CHAPTER – 1
Digital Signals and Systems
1.1 Should Software Engineers Worry About Hardware?
Some students of computer and information sciences look at
computer hardware the same way many drivers look at their cars: the
use of a car doesn’t require the knowledge of how to build one.
Knowing how to design and build a computer may not be vital to the
computer professional, but it goes a long way toward improving their
skills, i.e., making them better drivers. For anyone going into a career
involving computer programming, computer system design, or the
installation and maintenance of computer systems, the principles of
computer organization provide tools to create better designs. These
include:
• System design tools – The same design theories used at the lowest
level of system design are also applied at higher levels. For
example, the same methods a circuit board designer uses to create
the interface between a processor and its memory chips are used to
design the addressing scheme of an IP network.
• Software design tools – The same procedures used to optimize
digital circuits can be used for the logic portions of software.
Complex blocks of if-statements, for example, can be simplified or
made to run faster using these tools.
• Improved troubleshooting skills – A clear understanding of the
inner workings of a computer gives the technician servicing it the
tools to isolate a problem quicker and with greater accuracy.
• Interconnectivity – Hardware is needed to connect the real world to
a computer’s inputs and outputs. Writing software to control a
system such as an automotive air bag could produce catastrophic
results without a clear understanding of the architecture and
hardware of a microprocessor.
• Marketability – Embedded system design puts microprocessors into
task-specific applications such as manufacturing, communications,
and automotive control. As processors become cheaper and more
powerful, the same tools used for desktop software design are being
applied to embedded system design. This means that the software
1
2 Computer Organization and Design Fundamentals
engineer with experience in hardware design has a significant
advantage over hardware engineers in this market.
If that doesn’t convince you, take a look at what Shigeki Ishizuka,
the head of Sony’s digital camera division, says about understanding
hardware. “When you control parts design, you can integrate the whole
package much more elegantly.” In other words, today’s business
environment of low cost and rapid market response, success may
depend on how well you control the hardware of your system.
Think of the myriad of systems around you such as your car, cell
phone, and PlayStation® that rely on a programmer’s understanding of
hardware. A computer mouse, for example, sends digital information
into the computer’s mouse port. In order for the software to respond
properly to the movement or button presses of the mouse, the software
designer must be able to interpret the digital signal.
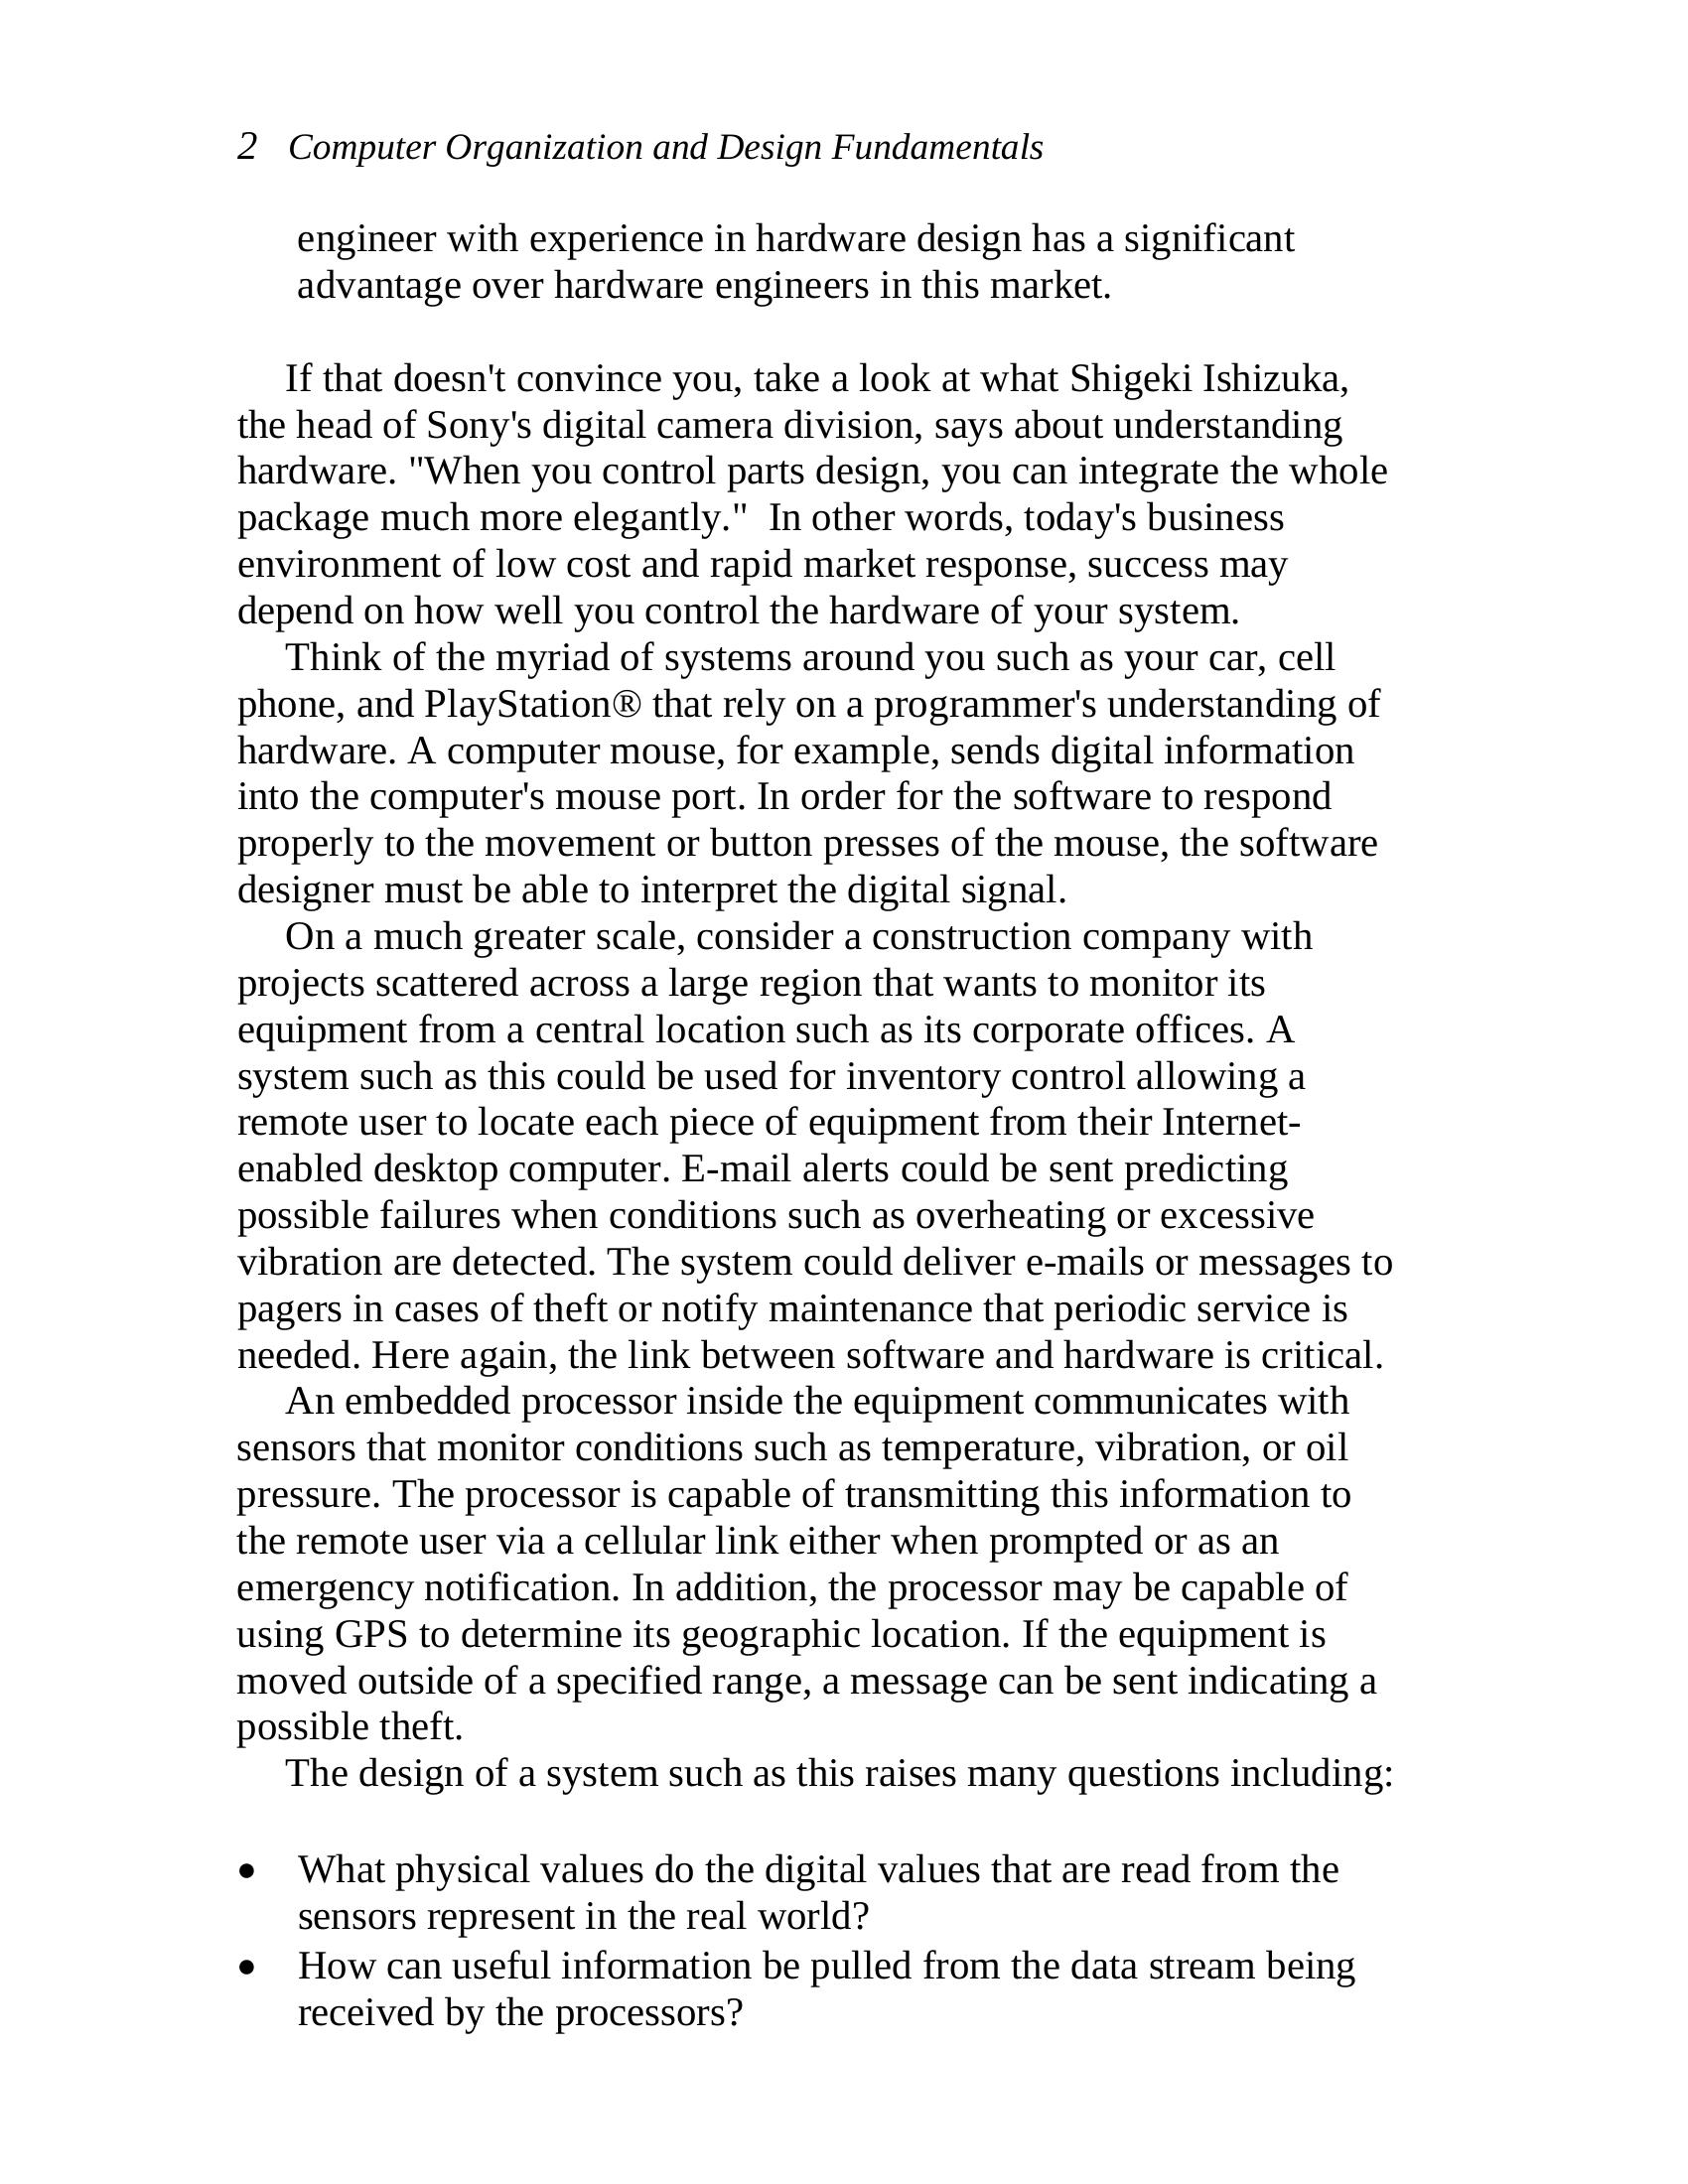
On a much greater scale, consider a construction company with
projects scattered across a large region that wants to monitor its
equipment from a central location such as its corporate offices. A
system such as this could be used for inventory control allowing a
remote user to locate each piece of equipment from their Internet-
enabled desktop computer. E-mail alerts could be sent predicting
possible failures when conditions such as overheating or excessive
vibration are detected. The system could deliver e-mails or messages to
pagers in cases of theft or notify maintenance that periodic service is
needed. Here again, the link between software and hardware is critical.
An embedded processor inside the equipment communicates with
sensors that monitor conditions such as temperature, vibration, or oil
pressure. The processor is capable of transmitting this information to
the remote user via a cellular link either when prompted or as an
emergency notification. In addition, the processor may be capable of
using GPS to determine its geographic location. If the equipment is
moved outside of a specified range, a message can be sent indicating a
possible theft.
The design of a system such as this raises many questions including:
• What physical values do the digital values that are read from the
sensors represent in the real world?
• How can useful information be pulled from the data stream being
received by the processors?
Chapter 1: Digital Signals and Systems 3
• How should the data be formatted for optimal storage, searching,
and retrieval?
• Is it possible that using a slower data rate might actually mean
shorter connect times over expensive cellular links?
Figure 1-1 Sample Digital System
Computer organization theories answer these and many other questions.
1.2 Non-Digital Signals
The real world is analog. What does that mean? Well, an analog
value is equivalent to a floating-point number with an infinite number
of places to the right of the decimal point. For example, temperatures
do not take on distinct values such as 75°, 76°, 77°, 78°, etc. They take
values like 75.434535… In fact, between the temperatures 75.435° and
75.436°, there are an infinite number of possible values. A man doesn’t
weigh exactly 178 pounds. Add an atom, and his weight changes.
When values such as temperature or weight change over time, they
follow what is called a continuous curve. Between any two values on
the curve, an infinite number of values take place over an infinite
number of points in time.
Okay, so these are ridiculous examples. We can get by without
knowing the weight of a man plus or minus an atom. Heck, if we
4 Computer Organization and Design Fundamentals
measured to that level of accuracy, his weight would be changing every
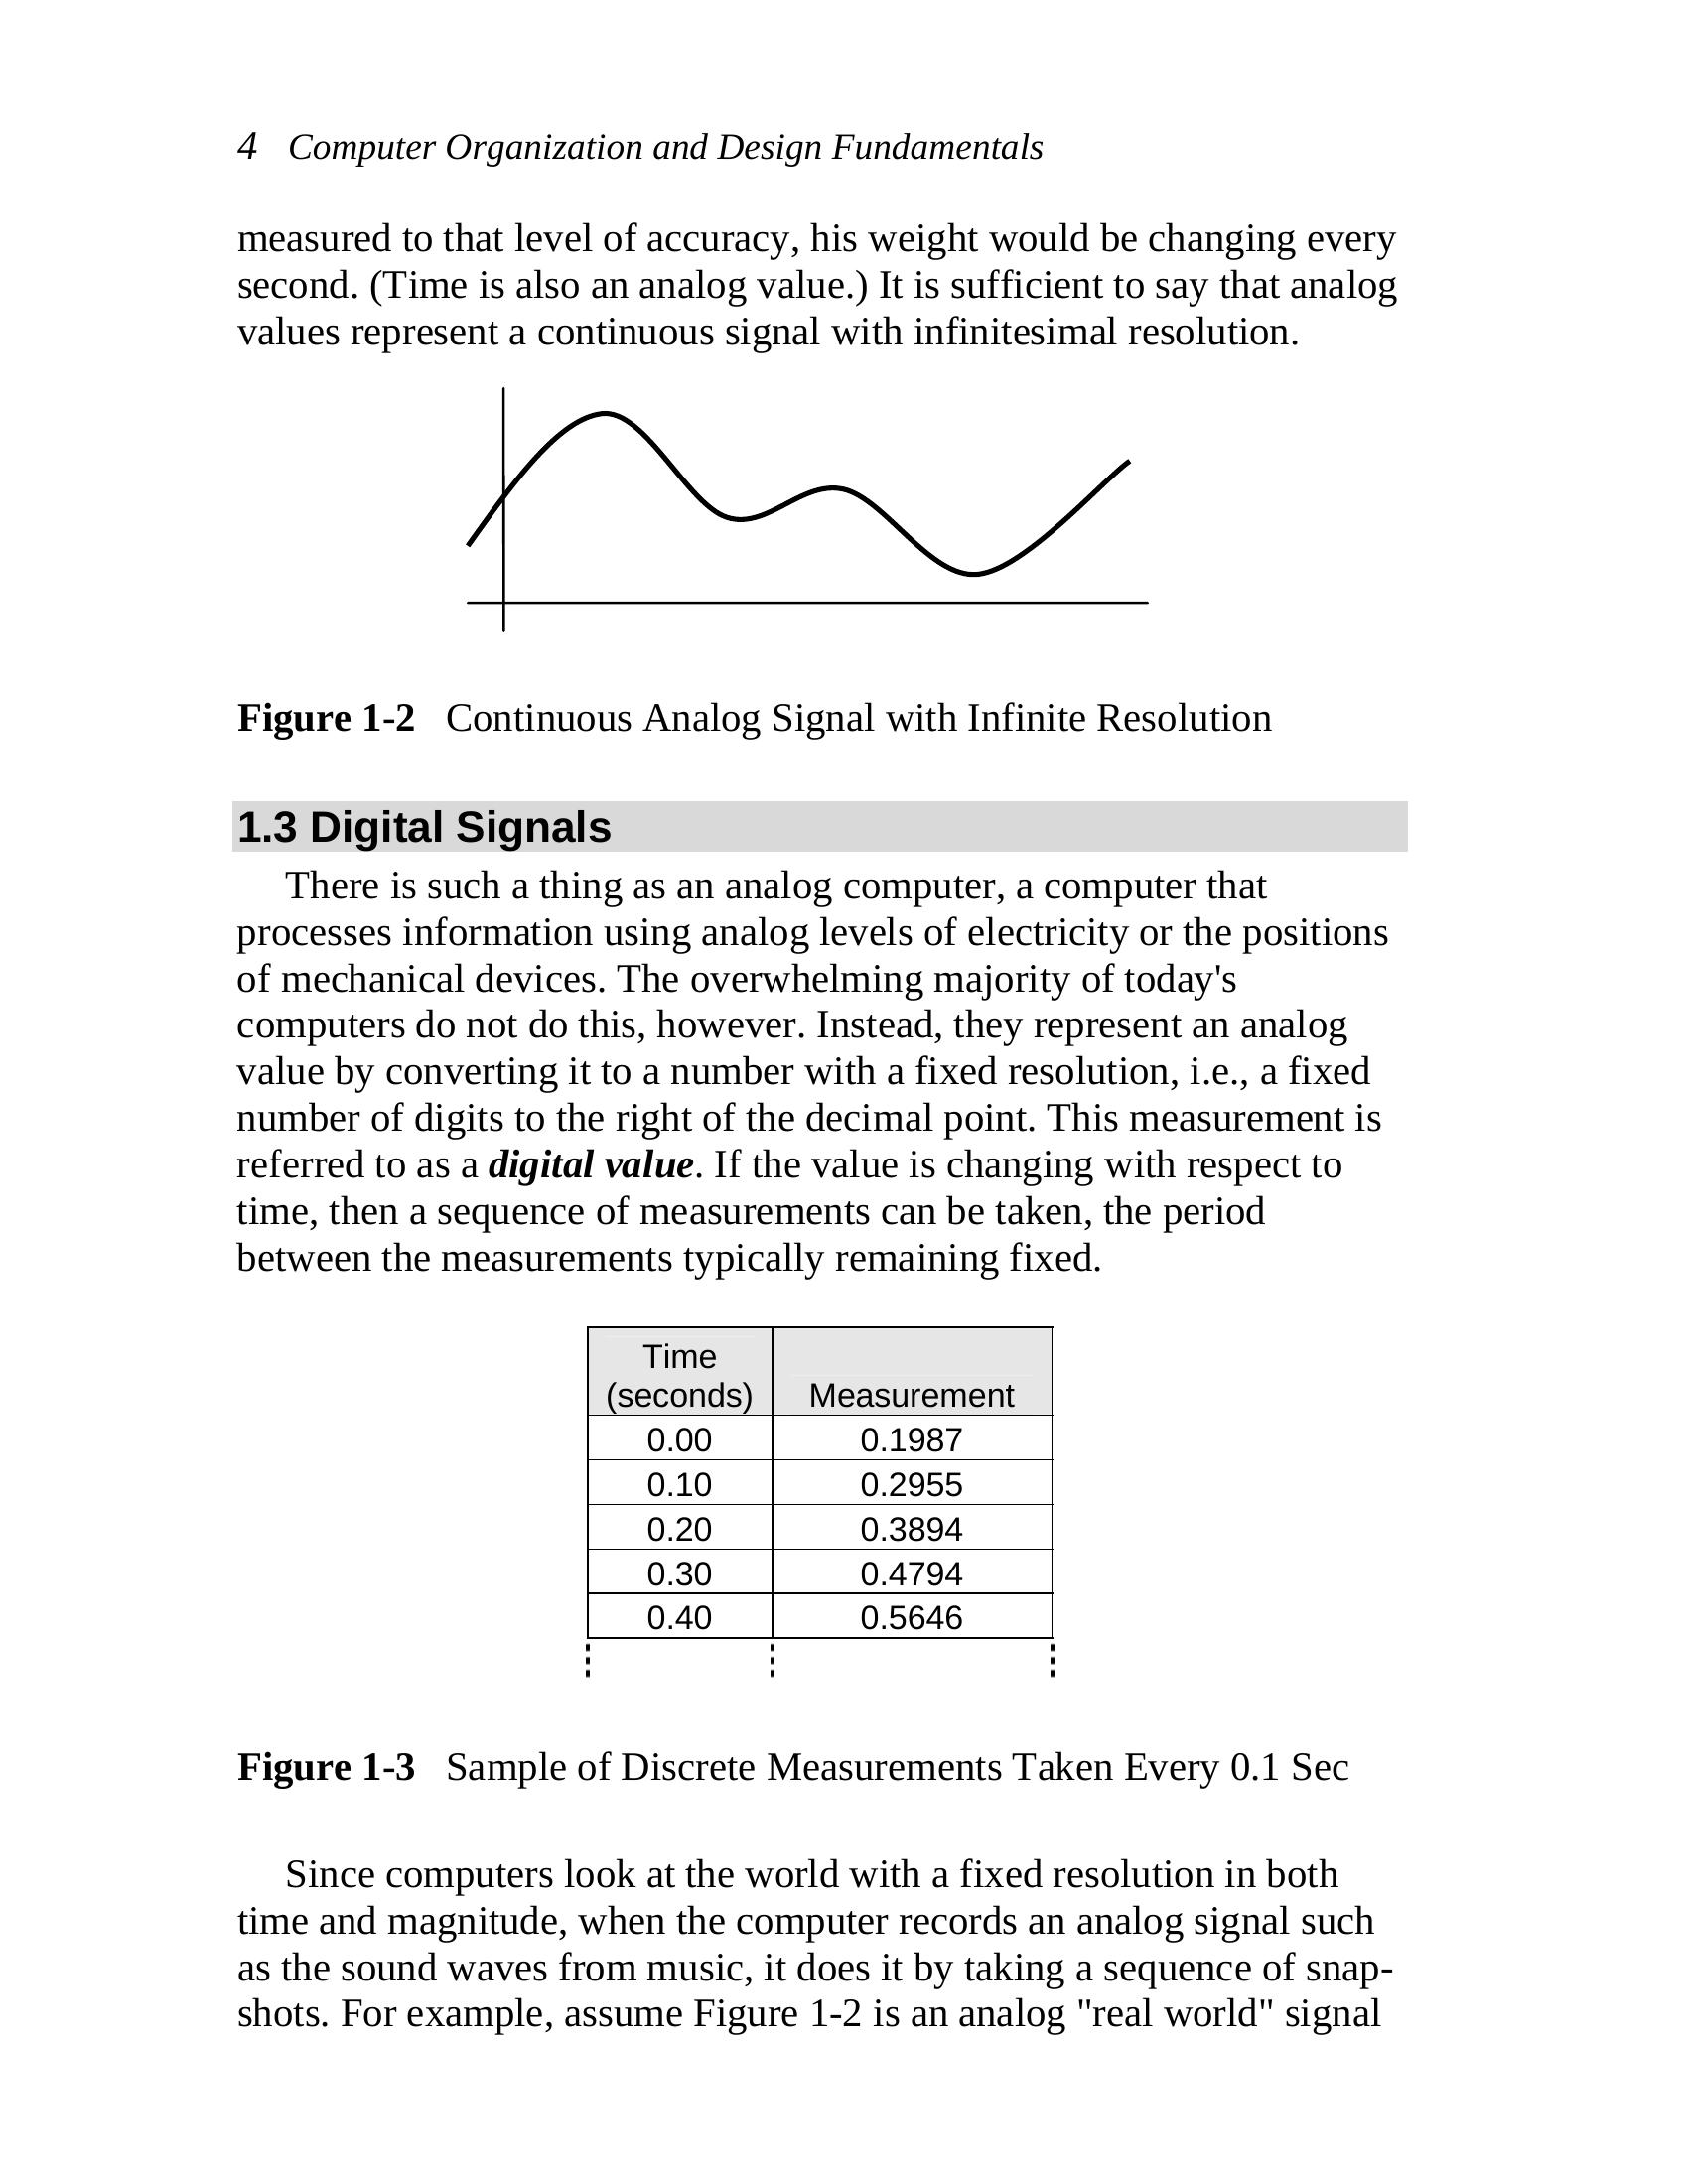
second. (Time is also an analog value.) It is sufficient to say that analog
values represent a continuous signal with infinitesimal resolution.
Figure 1-2 Continuous Analog Signal with Infinite Resolution
1.3 Digital Signals
There is such a thing as an analog computer, a computer that
processes information using analog levels of electricity or the positions
of mechanical devices. The overwhelming majority of today’s
computers do not do this, however. Instead, they represent an analog
value by converting it to a number with a fixed resolution, i.e., a fixed
number of digits to the right of the decimal point. This measurement is
referred to as a digital value. If the value is changing with respect to
time, then a sequence of measurements can be taken, the period
between the measurements typically remaining fixed.
Time
(seconds) Measurement
0.00 0.1987
0.10 0.2955
0.20 0.3894
0.30 0.4794
0.40 0.5646
Figure 1-3 Sample of Discrete Measurements Taken Every 0.1 Sec
Since computers look at the world with a fixed resolution in both
time and magnitude, when the computer records an analog signal such
as the sound waves from music, it does it by taking a sequence of snap-
shots. For example, assume Figure 1-2 is an analog “real world” signal
| Time (seconds) | Measurement |
| 0.00 | 0.1987 |
| 0.10 | 0.2955 |
| 0.20 | 0.3894 |
| 0.30 | 0.4794 |
| 0.40 | 0.5646 |
| Time |
| (seconds) |
Chapter 1: Digital Signals and Systems 5
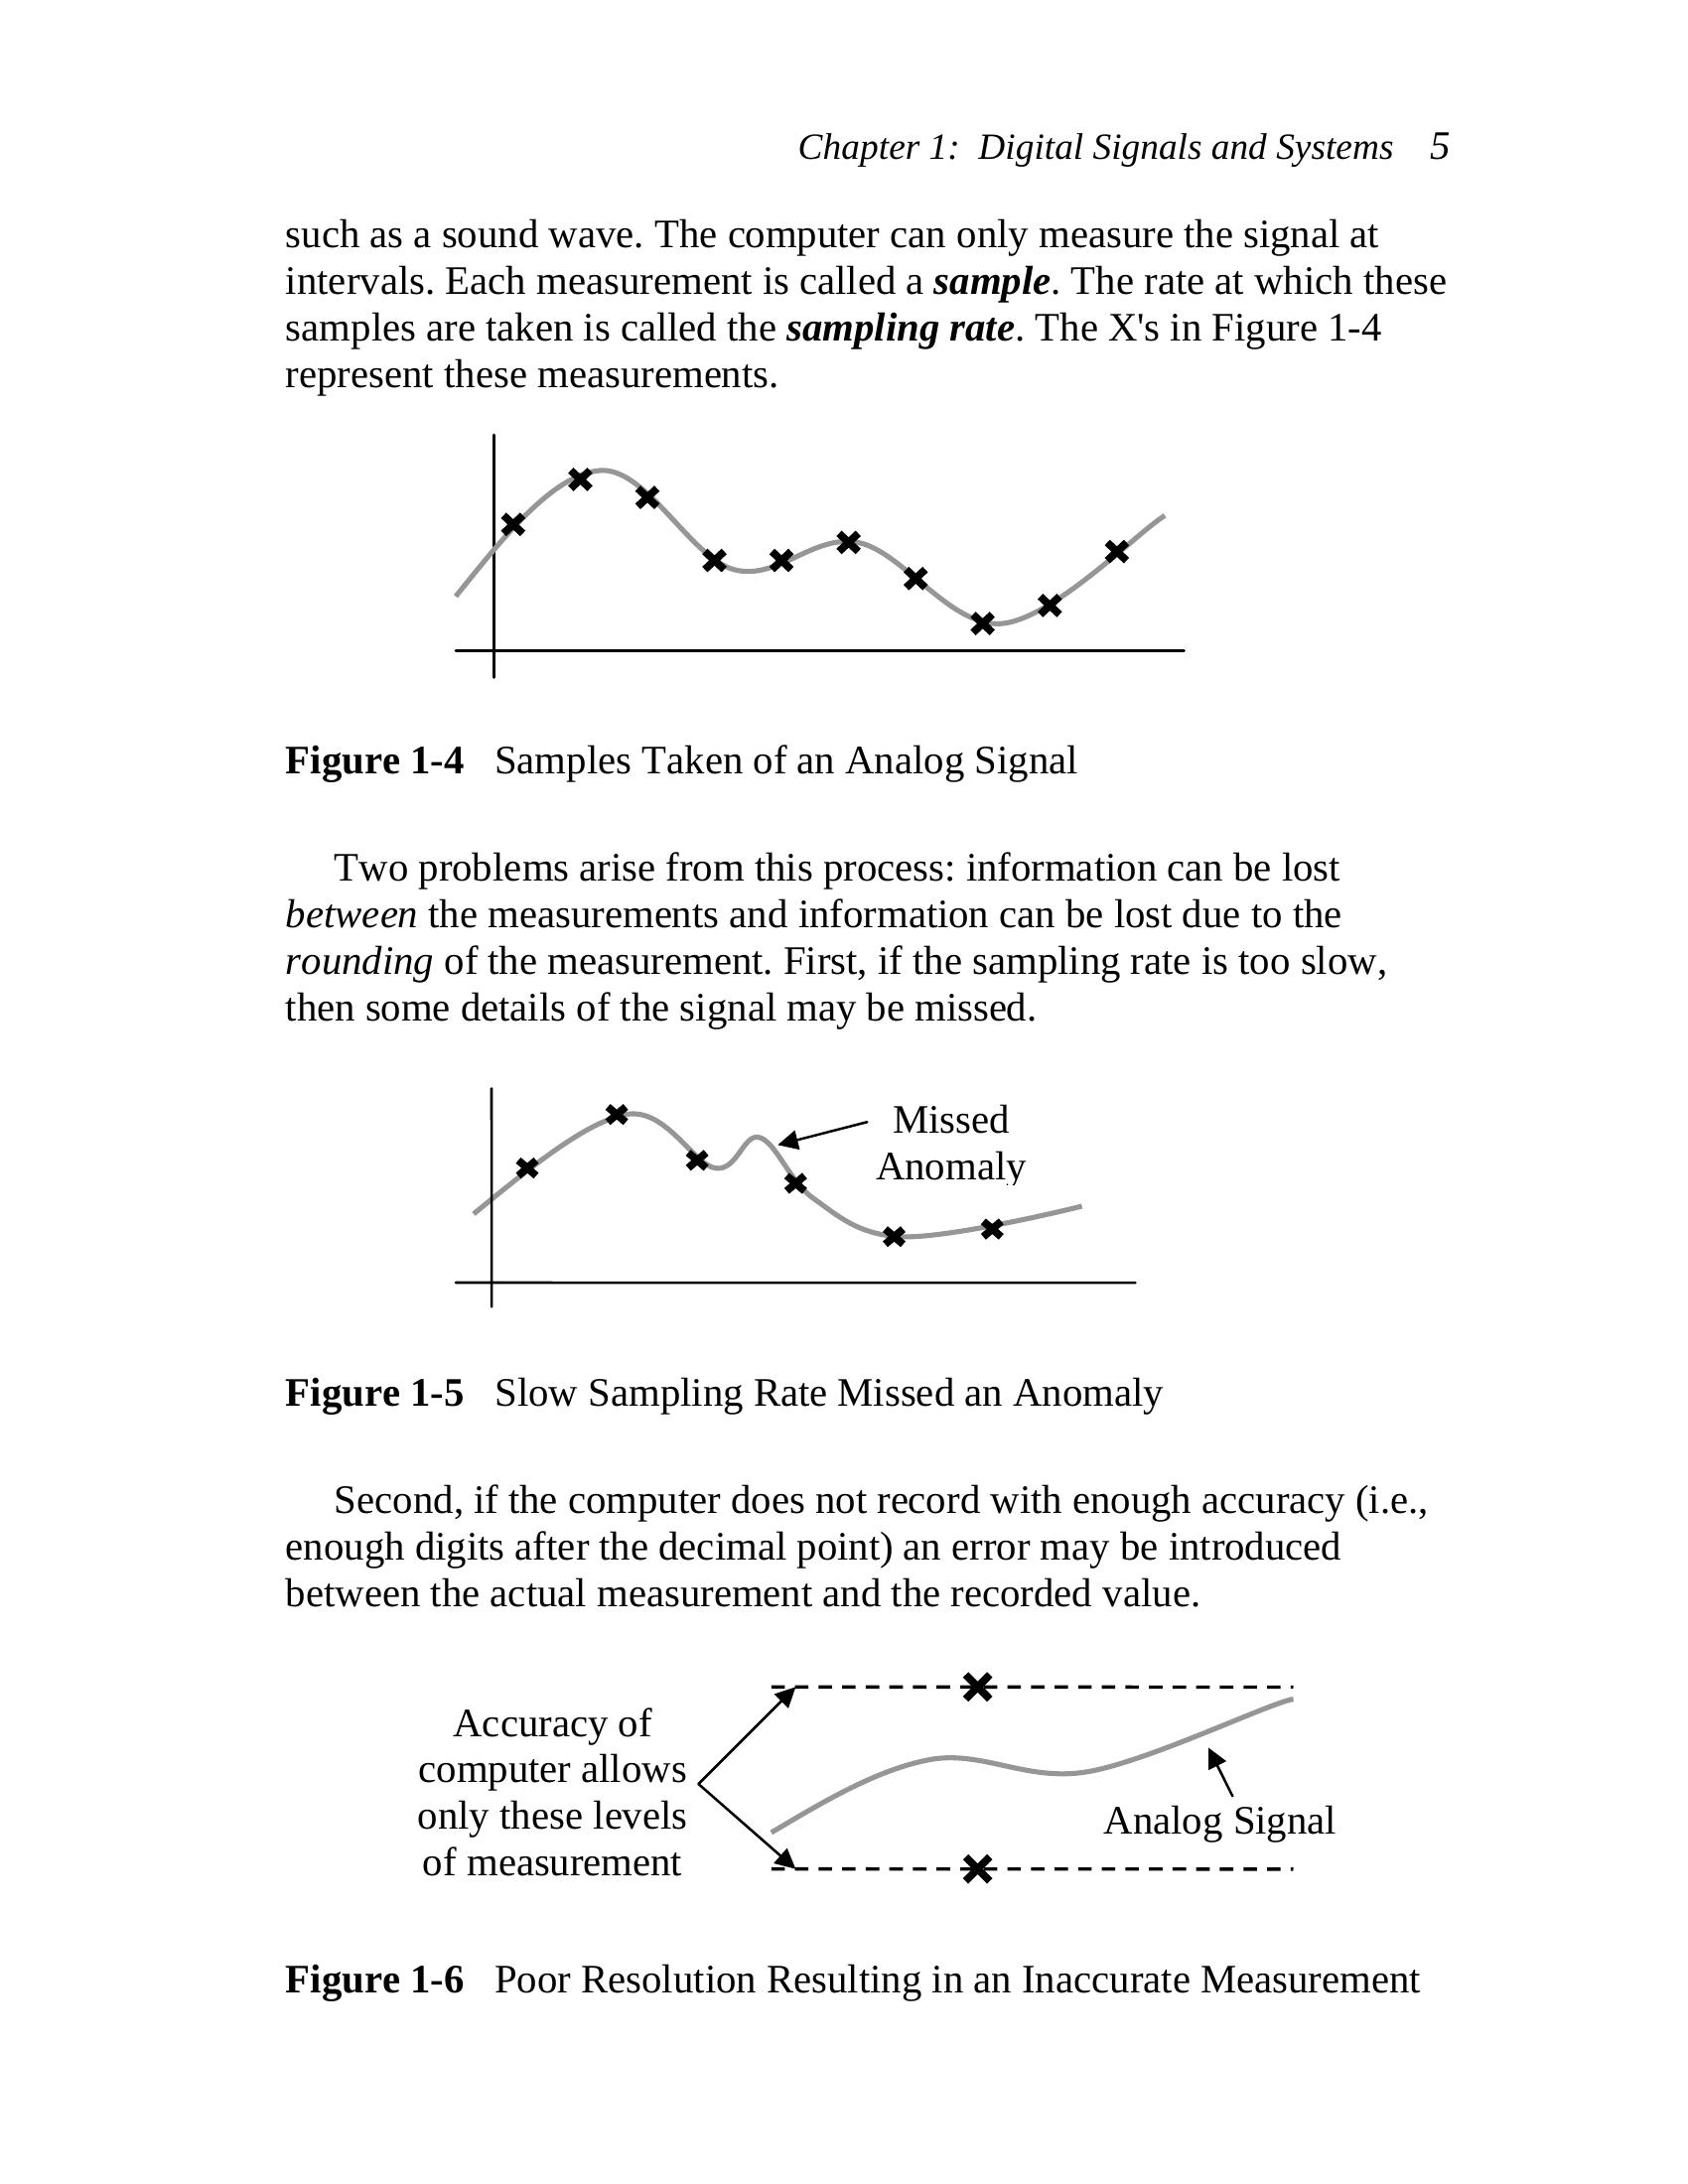
such as a sound wave. The computer can only measure the signal at
intervals. Each measurement is called a sample. The rate at which these
samples are taken is called the sampling rate. The X’s in Figure 1-4
represent these measurements.
Figure 1-4 Samples Taken of an Analog Signal
Two problems arise from this process: information can be lost
between the measurements and information can be lost due to the
rounding of the measurement. First, if the sampling rate is too slow,
then some details of the signal may be missed.
Missed
Anomaly
Figure 1-5 Slow Sampling Rate Missed an Anomaly
Second, if the computer does not record with enough accuracy (i.e.,
enough digits after the decimal point) an error may be introduced
between the actual measurement and the recorded value.
Accuracy of
computer allows
only these levels Analog Signal
of measurement
Figure 1-6 Poor Resolution Resulting in an Inaccurate Measurement
6 Computer Organization and Design Fundamentals
These effects can be reduced by increasing the resolution of the
measurement and increasing the sampling rate. A discussion of this can
be found in Chapter 2 in the section titled “Sampling Theory”.
1.4 Conversion Systems
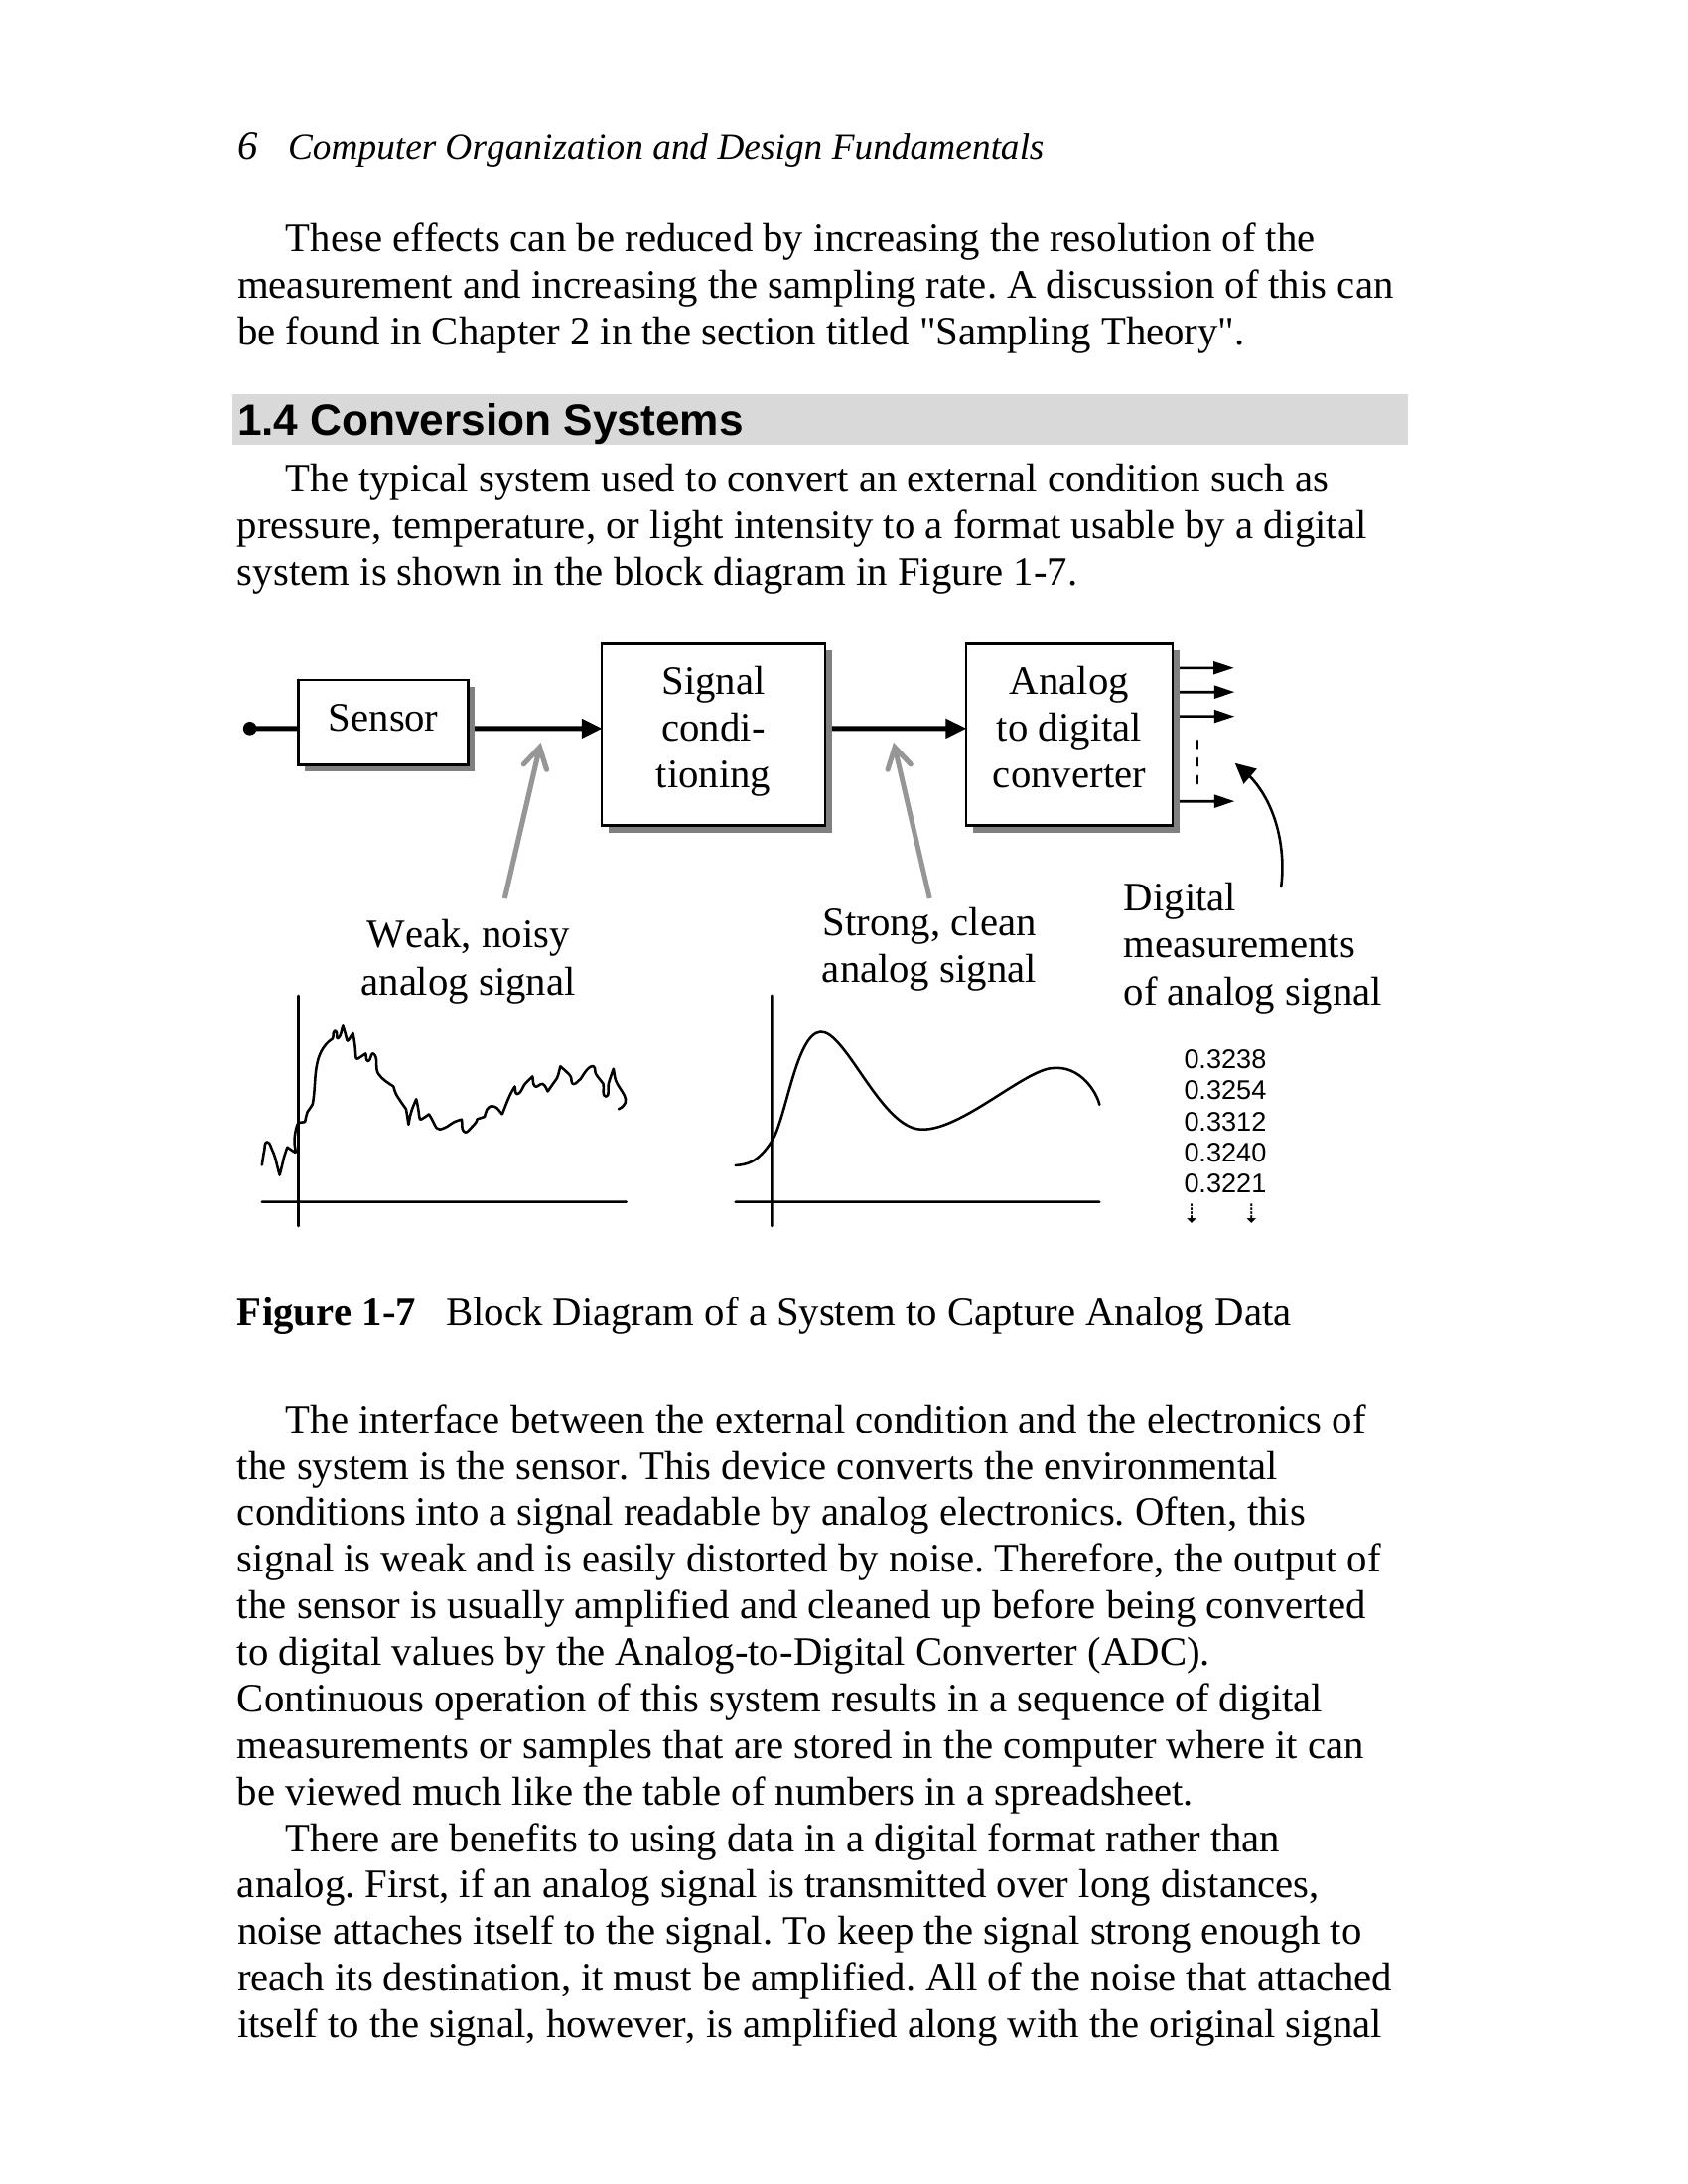
The typical system used to convert an external condition such as
pressure, temperature, or light intensity to a format usable by a digital
system is shown in the block diagram in Figure 1-7.
Signal Analog
Sensor
condi- to digital
tioning converter
Digital
Strong, clean
Weak, noisy
measurements
analog signal
analog signal
of analog signal
0.3238
0.3254
0.3312
0.3240
0.3221
(cid:25) (cid:25)
Figure 1-7 Block Diagram of a System to Capture Analog Data
The interface between the external condition and the electronics of
the system is the sensor. This device converts the environmental
conditions into a signal readable by analog electronics. Often, this
signal is weak and is easily distorted by noise. Therefore, the output of
the sensor is usually amplified and cleaned up before being converted
to digital values by the Analog-to-Digital Converter (ADC).
Continuous operation of this system results in a sequence of digital
measurements or samples that are stored in the computer where it can
be viewed much like the table of numbers in a spreadsheet.
There are benefits to using data in a digital format rather than
analog. First, if an analog signal is transmitted over long distances,
noise attaches itself to the signal. To keep the signal strong enough to
reach its destination, it must be amplified. All of the noise that attached
itself to the signal, however, is amplified along with the original signal
| Sensor |
Chapter 1: Digital Signals and Systems 7
resulting in distortion. For example, before the advent of digital phone
networks, long distance phone calls over analog lines were often full of
static and interference that made understanding people who were
physically farther away more difficult.
Noise cannot attach itself to a digital signal. Once an analog signal
has been converted to a sequence of numbers, the signal’s
characteristics remain the same as long as the numbers don’t change.
Therefore, digital systems such as the contemporary long-distance
phone system do not suffer from degradation over long distances.
A second benefit is that once a signal is turned into a sequence of
numbers, mathematical algorithms can be used to operate on the data.
Disciplines such as Digital Signal Processing (DSP) and the study of
wavelets allow for much more accurate processing of signals than
analog systems were ever able to achieve.
A sequence of digital numbers can also be stored more compactly
than an analog signal. The data compression behind the MP3
technology is not remotely possible with analog technology. In
addition, supplementary data can be stored along with the samples for
information such as digital watermarking for security or codes for error
checking or error correction.
These advantages come at a price, however. As mentioned earlier, if
the samples are taken too slowly, details of the analog input are missed.
If the resolution of the samples is not fine enough, the signal may not
be precisely represented with the digital values. Last of all, additional
hardware is required to convert the signal from analog to digital.
1.5 Representation of Digital Signals
Digital systems do not store numbers the way humans do. A human
can remember the number 4.5 and understand that it represents a
quantity. The digital system does not have this capability. Instead,
digital systems work with numbers using millions of tiny switches
called transistors. Each transistor can remember only one of two
possible values, on or off. This is referred to as a binary system.
The values represented by the transistors of a binary system can be
interpreted as needed by the application. On and off can just as easily
mean 1 or 0, yes or no, true or false, up or down, or high or low. At this
point, it is immaterial what the two values represent. What matters is
that there are only two possible values per transistor. The complexity of
the computer comes in how the millions of transistors are designed to
8 Computer Organization and Design Fundamentals
work together. For the purpose of this discussion, the two values of a
transistor will be referred to as logic 1 and logic 0.
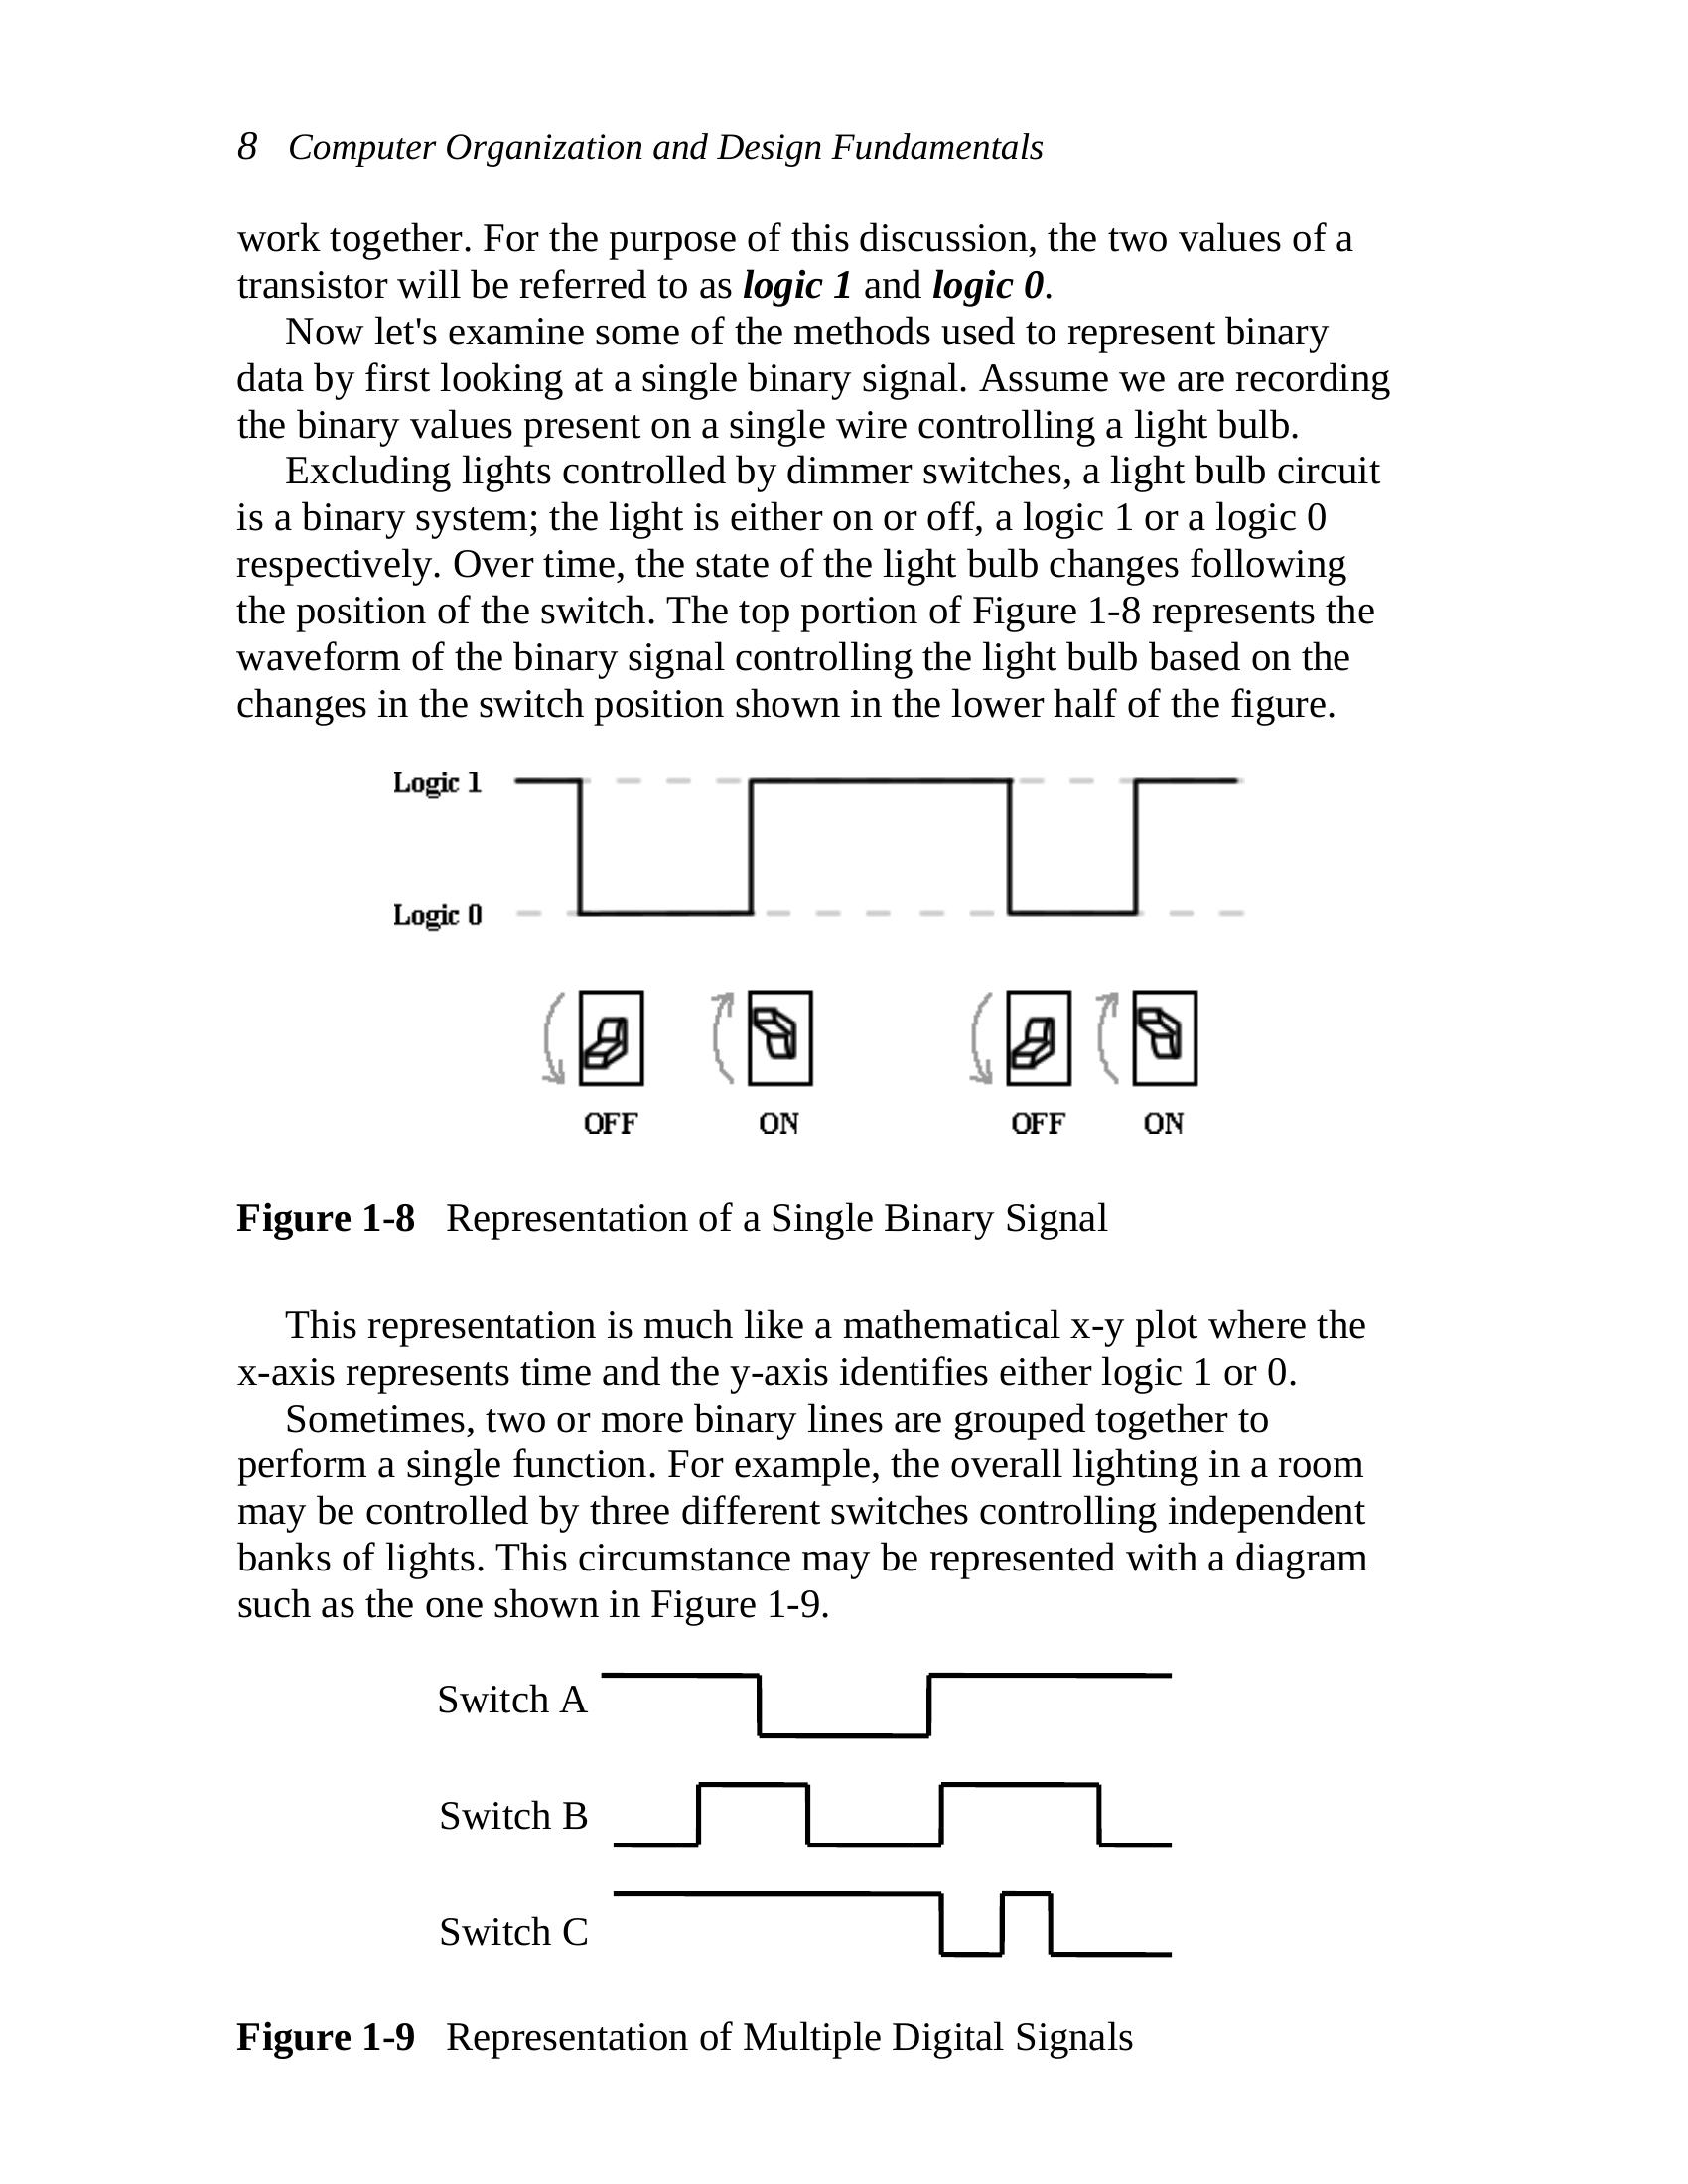
Now let’s examine some of the methods used to represent binary
data by first looking at a single binary signal. Assume we are recording
the binary values present on a single wire controlling a light bulb.
Excluding lights controlled by dimmer switches, a light bulb circuit
is a binary system; the light is either on or off, a logic 1 or a logic 0
respectively. Over time, the state of the light bulb changes following
the position of the switch. The top portion of Figure 1-8 represents the
waveform of the binary signal controlling the light bulb based on the
changes in the switch position shown in the lower half of the figure.
Figure 1-8 Representation of a Single Binary Signal
This representation is much like a mathematical x-y plot where the
x-axis represents time and the y-axis identifies either logic 1 or 0.
Sometimes, two or more binary lines are grouped together to
perform a single function. For example, the overall lighting in a room
may be controlled by three different switches controlling independent
banks of lights. This circumstance may be represented with a diagram
such as the one shown in Figure 1-9.
Switch A
Switch B
Switch C
Figure 1-9 Representation of Multiple Digital Signals
Chapter 1: Digital Signals and Systems 9
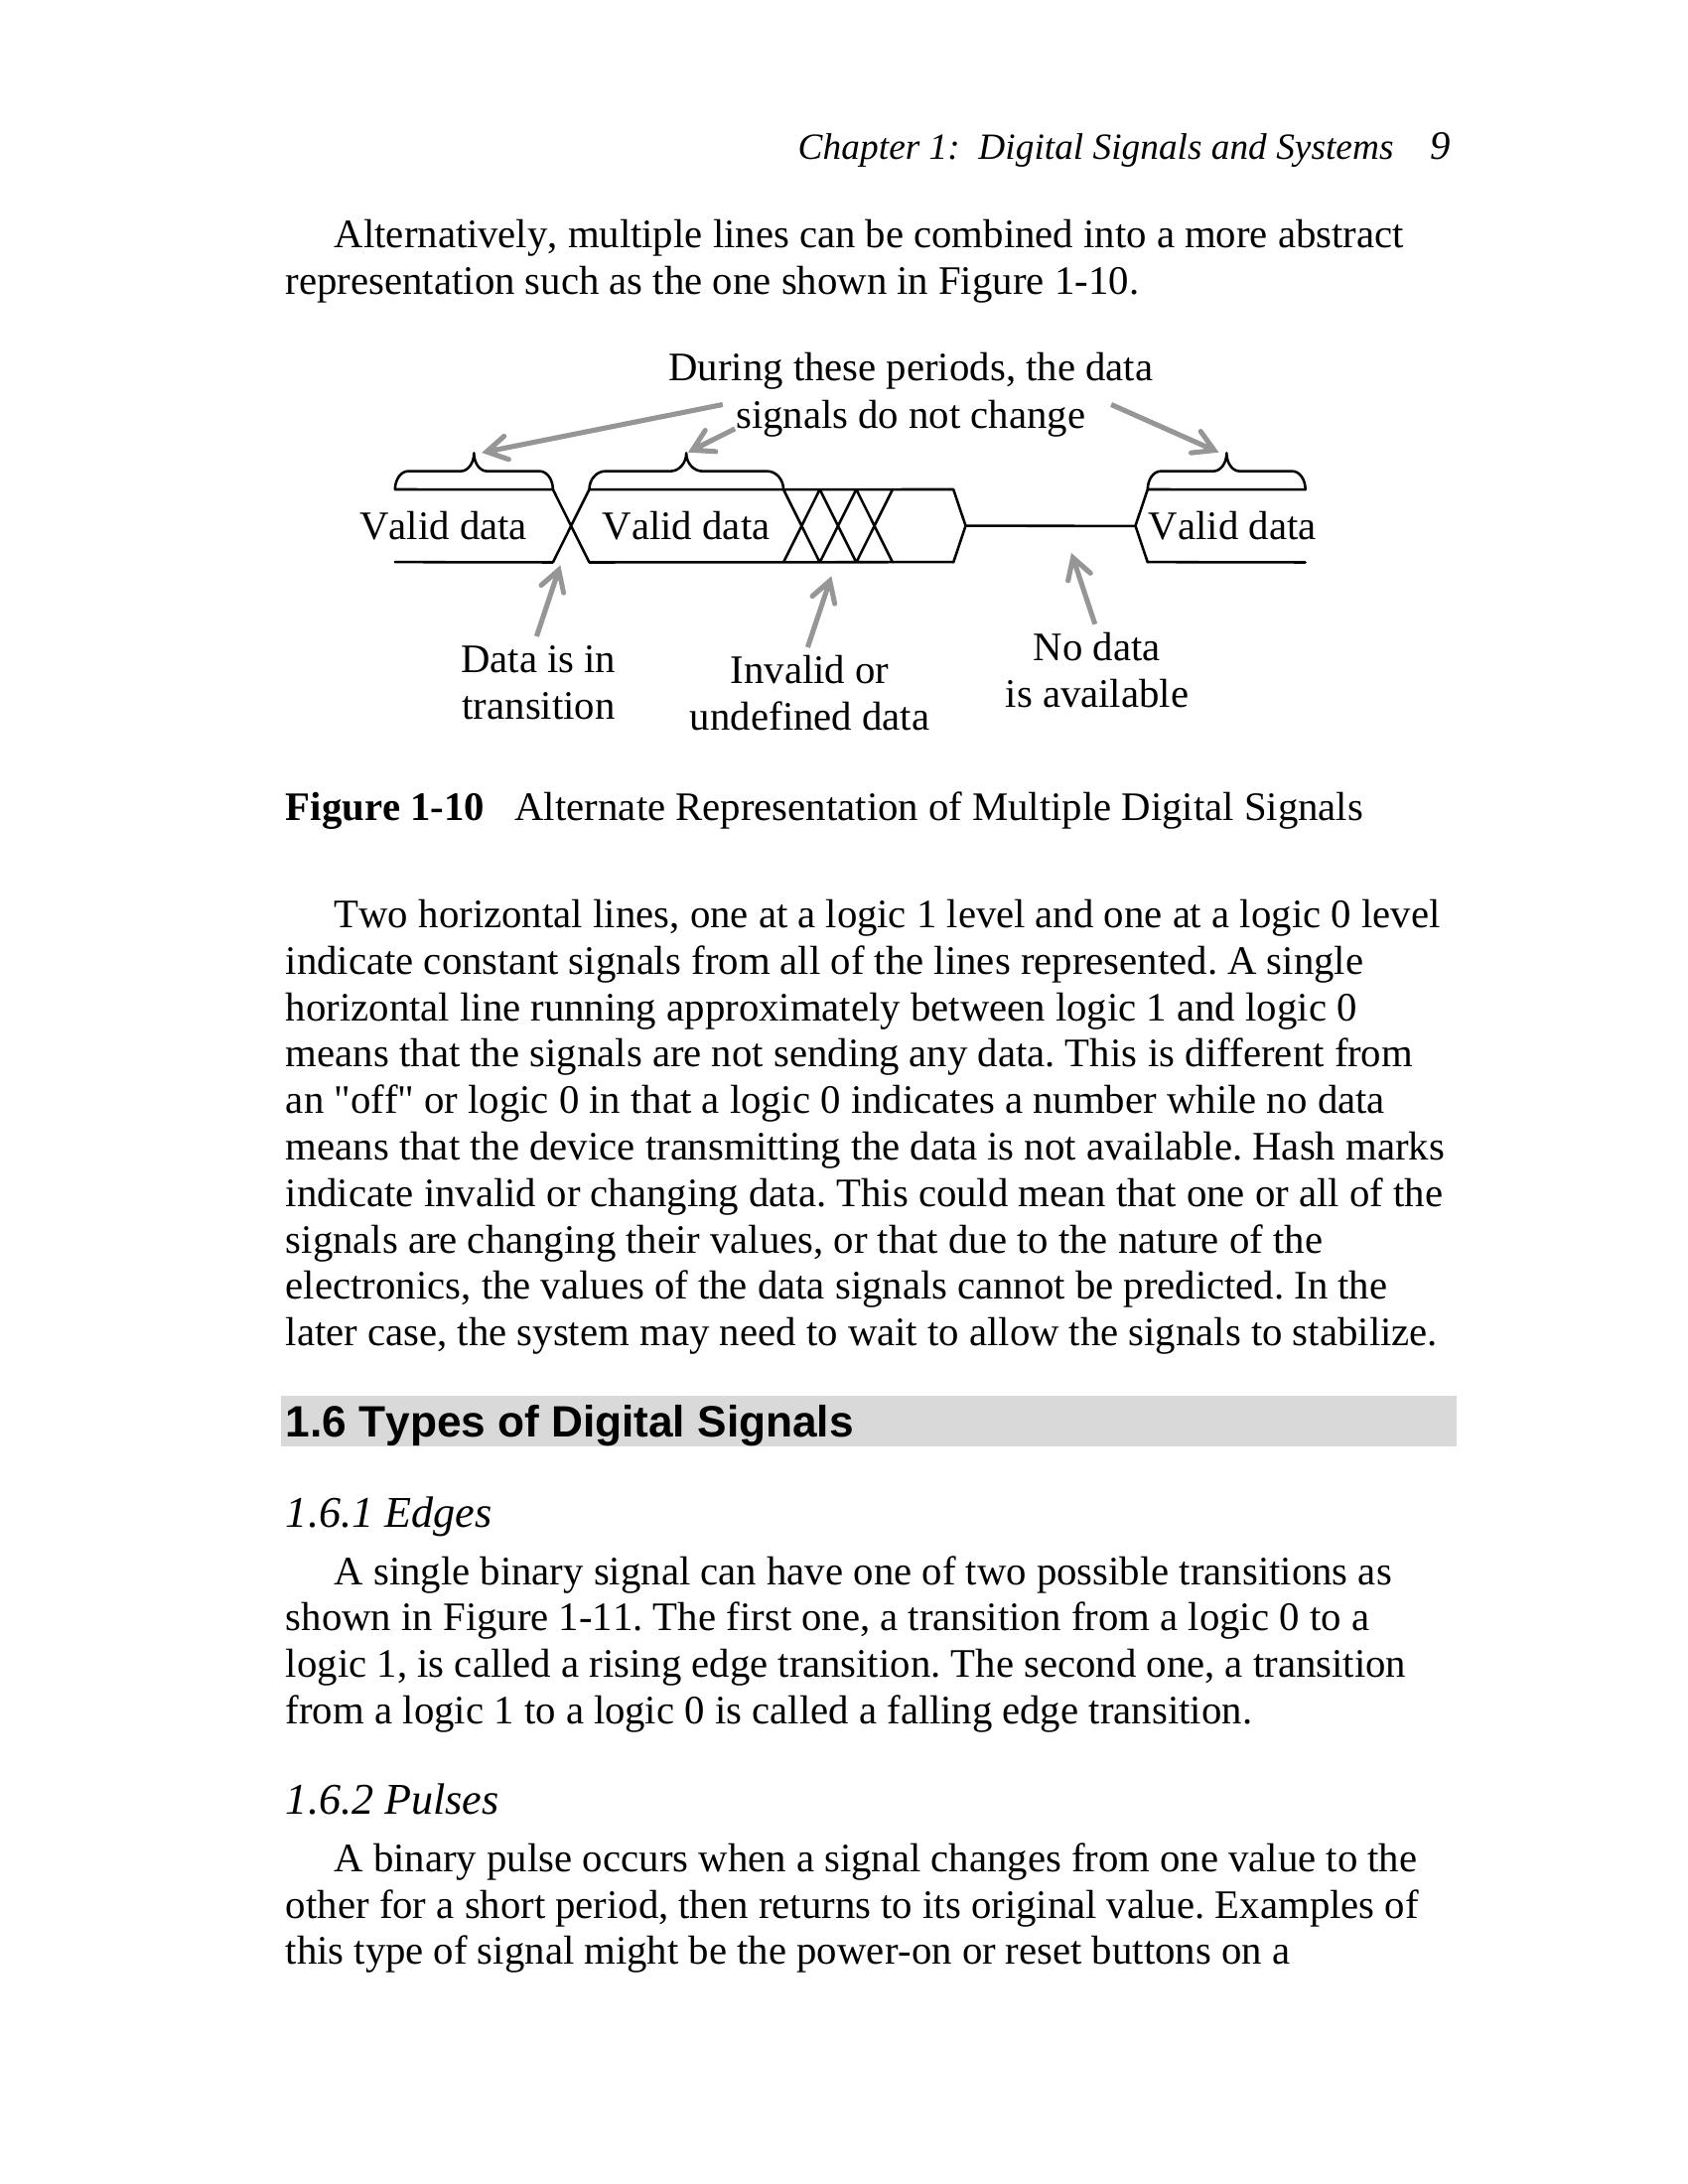
Alternatively, multiple lines can be combined into a more abstract
representation such as the one shown in Figure 1-10.
During these periods, the data
signals do not change
Valid data Valid data Valid data
Data is in
No data
Invalid or
transition
is available
undefined data
Figure 1-10 Alternate Representation of Multiple Digital Signals
Two horizontal lines, one at a logic 1 level and one at a logic 0 level
indicate constant signals from all of the lines represented. A single
horizontal line running approximately between logic 1 and logic 0
means that the signals are not sending any data. This is different from
an “off” or logic 0 in that a logic 0 indicates a number while no data
means that the device transmitting the data is not available. Hash marks
indicate invalid or changing data. This could mean that one or all of the
signals are changing their values, or that due to the nature of the
electronics, the values of the data signals cannot be predicted. In the
later case, the system may need to wait to allow the signals to stabilize.
1.6 Types of Digital Signals
1.6.1 Edges
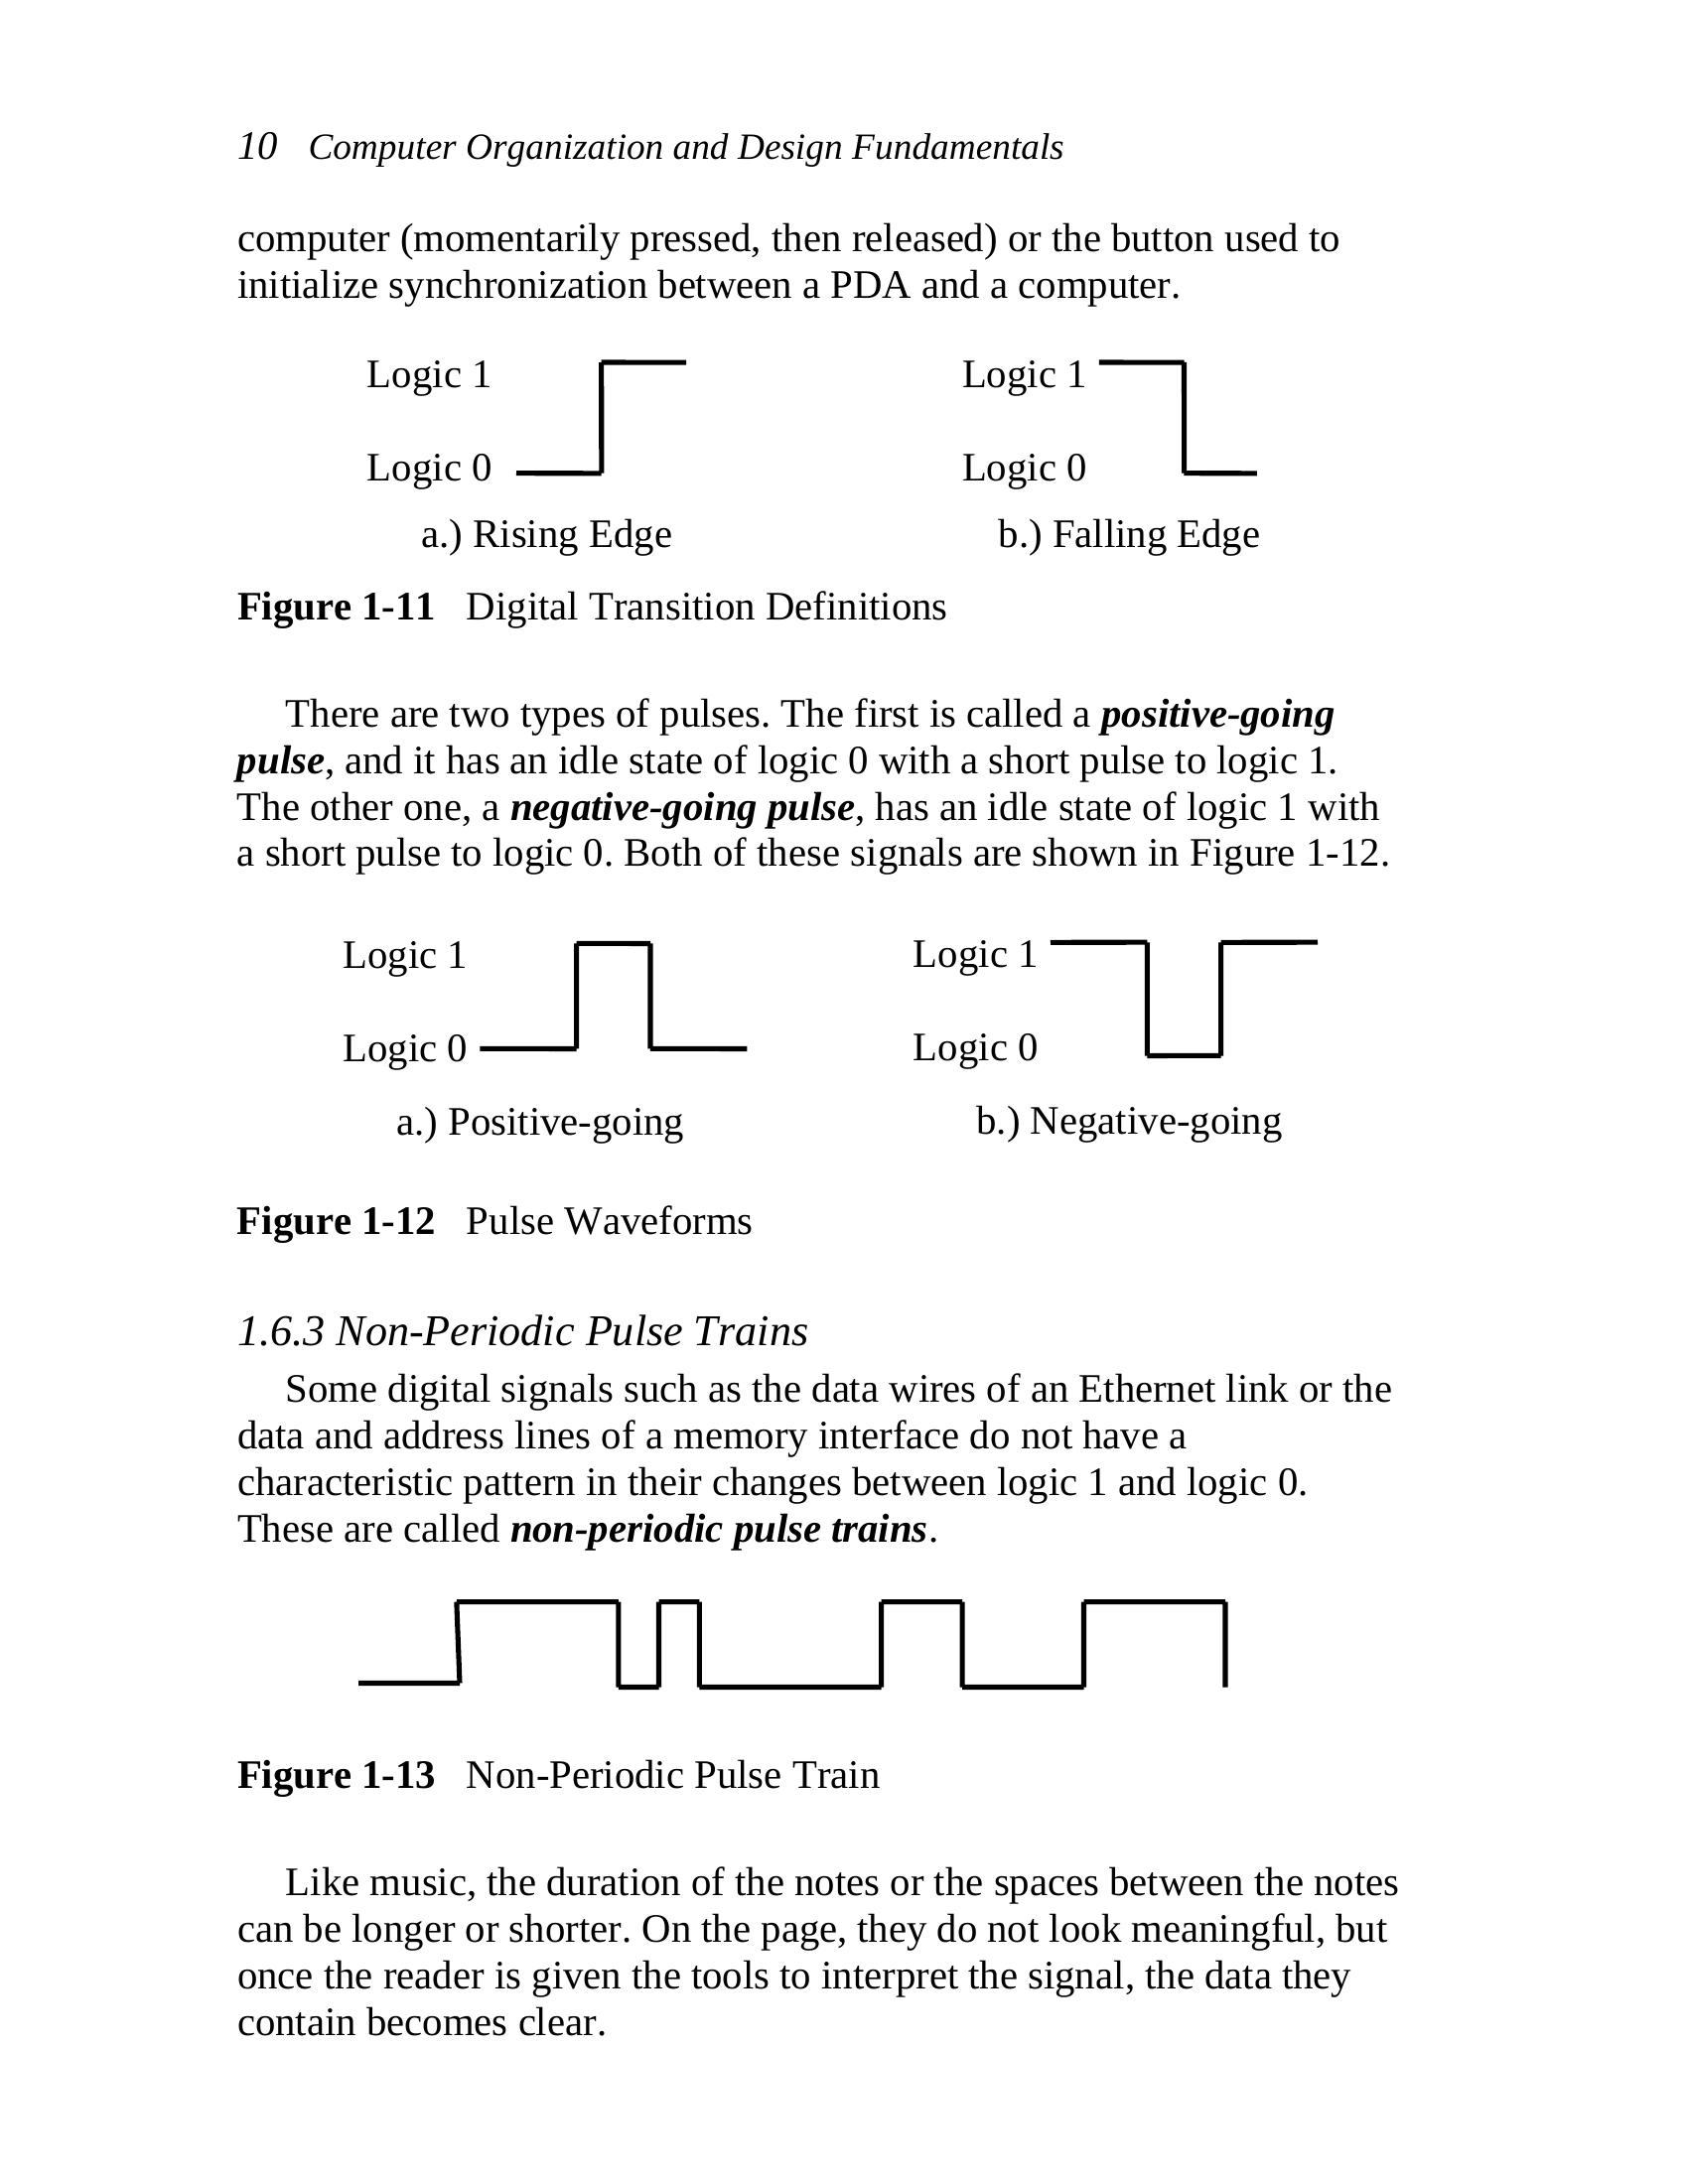
A single binary signal can have one of two possible transitions as
shown in Figure 1-11. The first one, a transition from a logic 0 to a
logic 1, is called a rising edge transition. The second one, a transition
from a logic 1 to a logic 0 is called a falling edge transition.
1.6.2 Pulses
A binary pulse occurs when a signal changes from one value to the
other for a short period, then returns to its original value. Examples of
this type of signal might be the power-on or reset buttons on a
10 Computer Organization and Design Fundamentals
computer (momentarily pressed, then released) or the button used to
initialize synchronization between a PDA and a computer.
Logic 1 Logic 1
Logic 0 Logic 0
a.) Rising Edge b.) Falling Edge
Figure 1-11 Digital Transition Definitions
There are two types of pulses. The first is called a positive-going
pulse, and it has an idle state of logic 0 with a short pulse to logic 1.
The other one, a negative-going pulse, has an idle state of logic 1 with
a short pulse to logic 0. Both of these signals are shown in Figure 1-12.
Logic 1 Logic 1
Logic 0 Logic 0
a.) Positive-going b.) Negative-going
Figure 1-12 Pulse Waveforms
1.6.3 Non-Periodic Pulse Trains
Some digital signals such as the data wires of an Ethernet link or the
data and address lines of a memory interface do not have a
characteristic pattern in their changes between logic 1 and logic 0.
These are called non-periodic pulse trains.
Figure 1-13 Non-Periodic Pulse Train
Like music, the duration of the notes or the spaces between the notes
can be longer or shorter. On the page, they do not look meaningful, but
once the reader is given the tools to interpret the signal, the data they
contain becomes clear.
Chapter 1: Digital Signals and Systems 11
1.6.4 Periodic Pulse Trains
Some signals act as the heartbeat to a digital system. For example, a
signal might tell a system, “Every 1/100th of a second, you need to
____.” The output from a car’s processor to control the engine’s spark
plug is such a signal. These signals are referred to as periodic pulse
trains. Like the drum beat to a song, a periodic pulse train is meant to
synchronize events or keep processes moving.
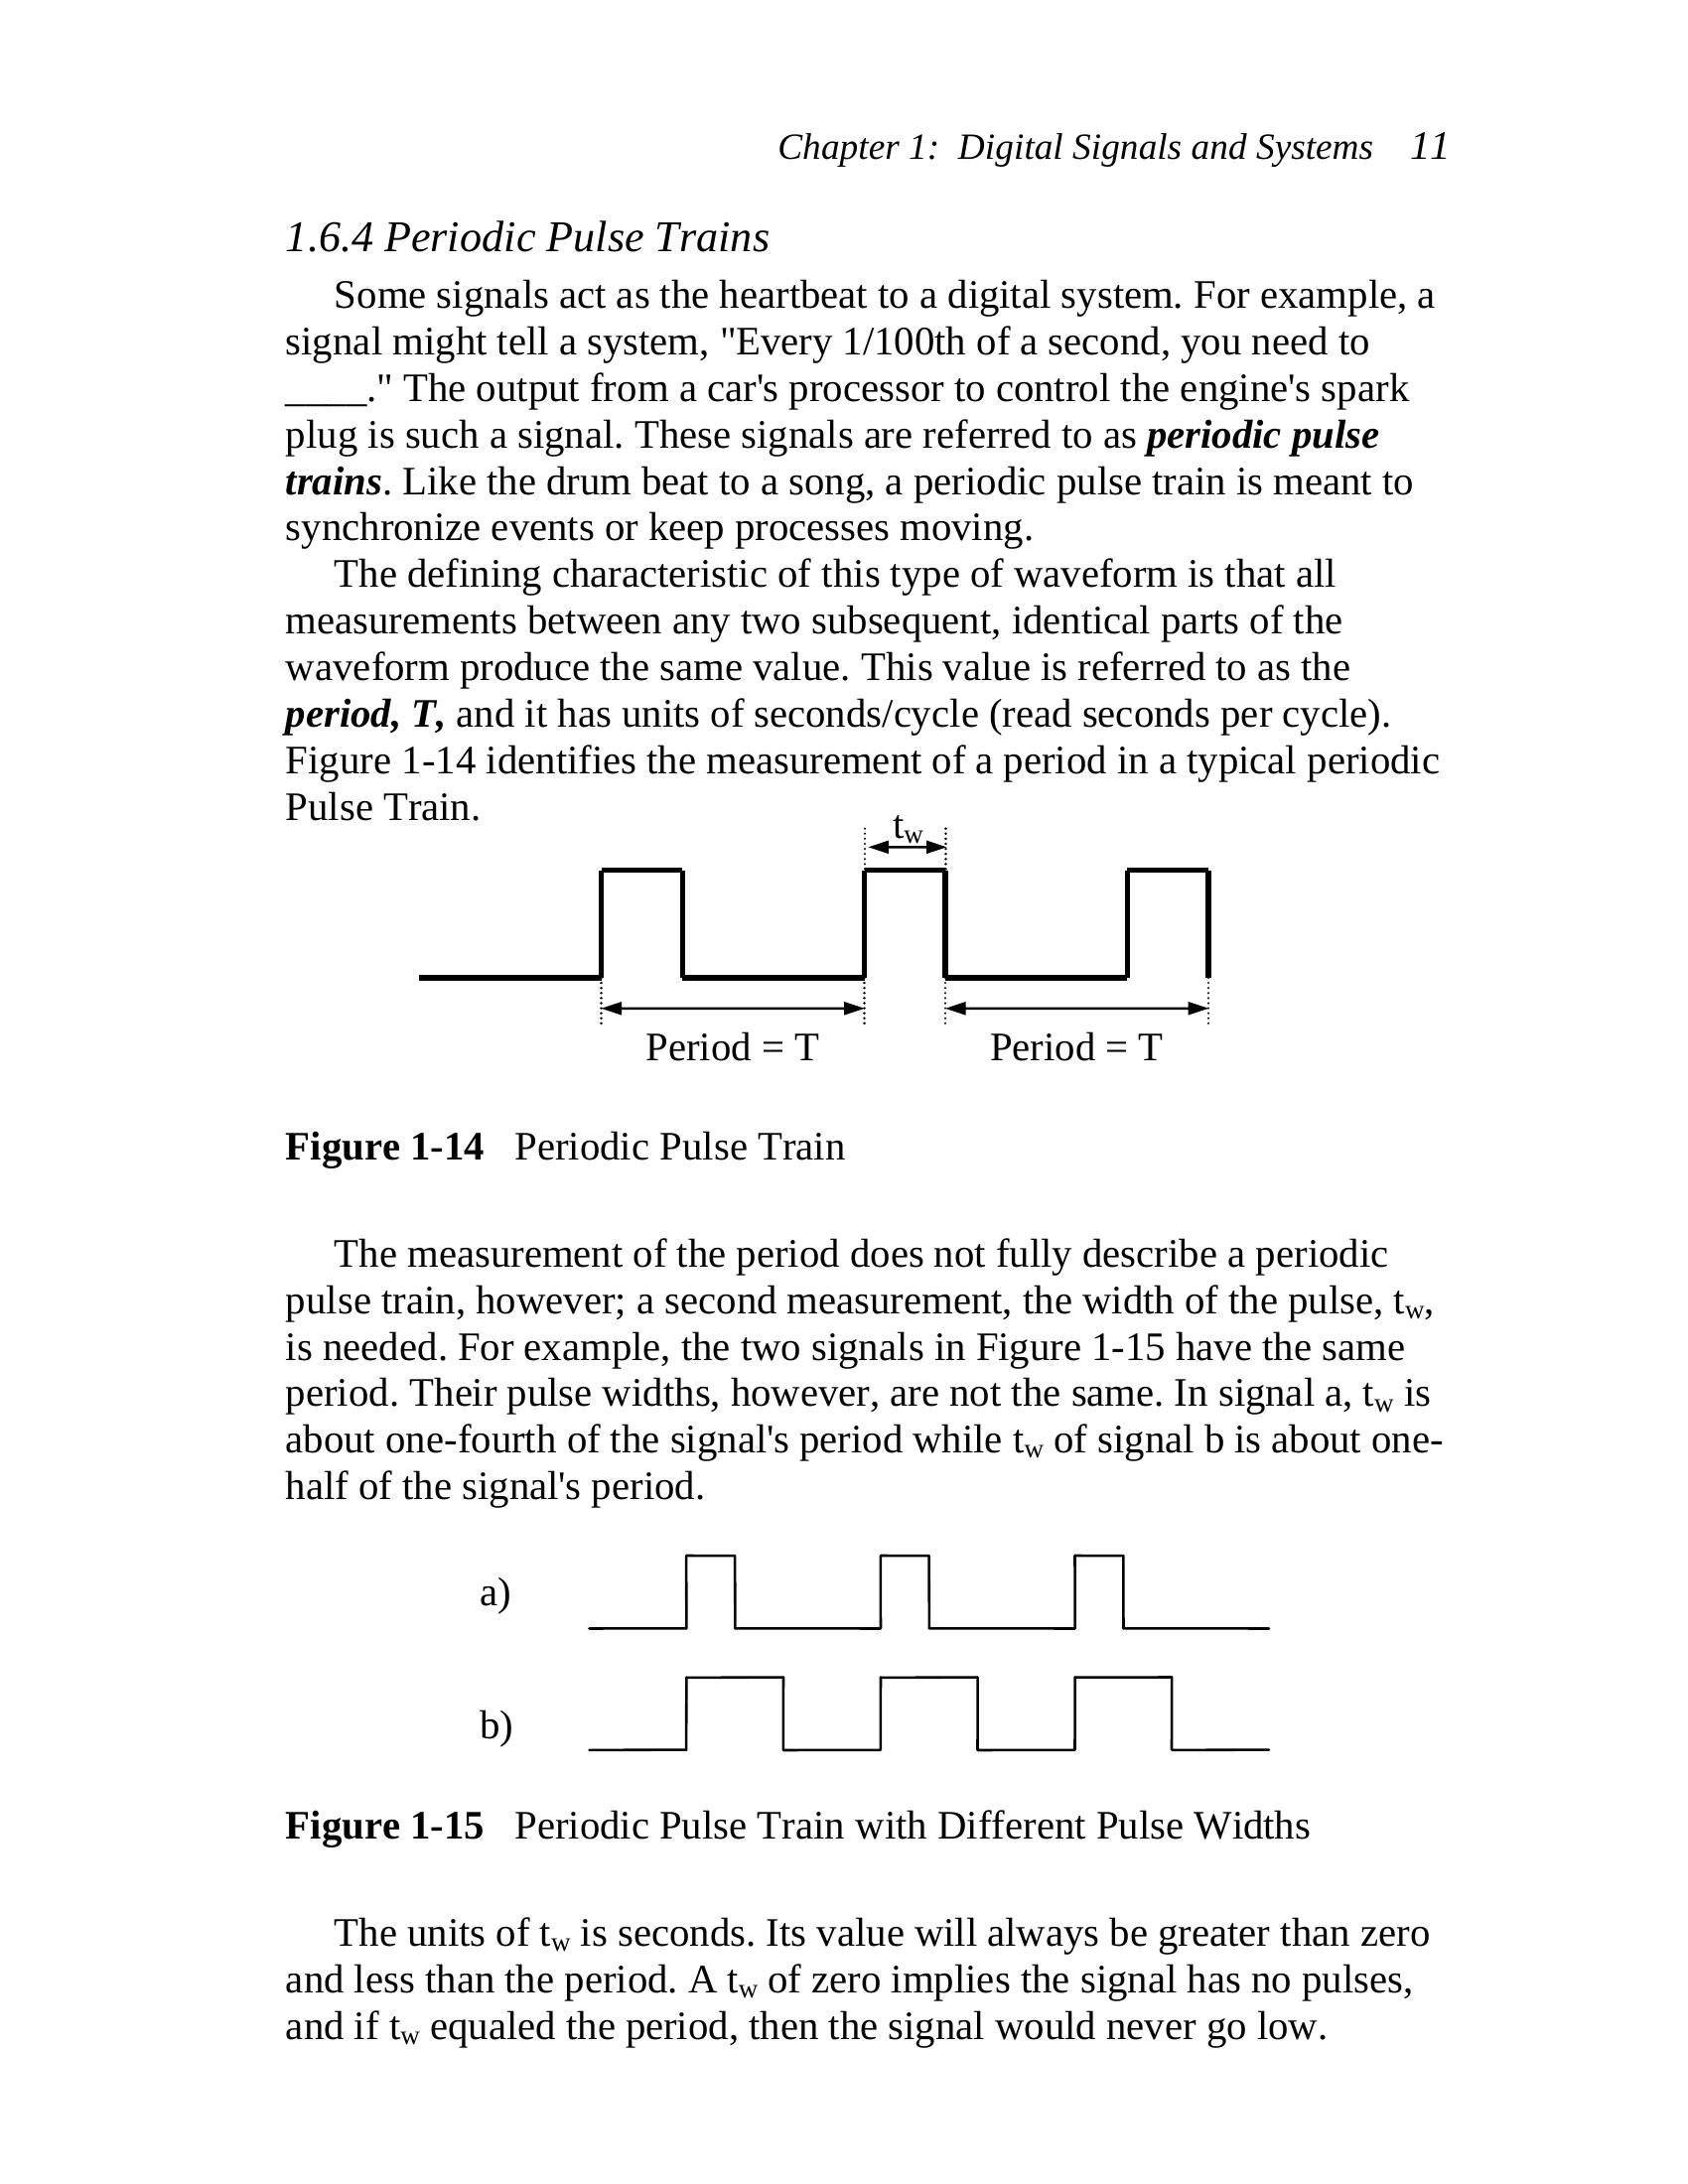
The defining characteristic of this type of waveform is that all
measurements between any two subsequent, identical parts of the
waveform produce the same value. This value is referred to as the
period, T, and it has units of seconds/cycle (read seconds per cycle).
Figure 1-14 identifies the measurement of a period in a typical periodic
Pulse Train.
t
w
Period = T Period = T
Figure 1-14 Periodic Pulse Train
The measurement of the period does not fully describe a periodic
pulse train, however; a second measurement, the width of the pulse, t ,
w
is needed. For example, the two signals in Figure 1-15 have the same
period. Their pulse widths, however, are not the same. In signal a, t is
w
about one-fourth of the signal’s period while t of signal b is about one-
w
half of the signal’s period.
a)
b)
Figure 1-15 Periodic Pulse Train with Different Pulse Widths
The units of t is seconds. Its value will always be greater than zero
w
and less than the period. A t of zero implies the signal has no pulses,
w
and if t equaled the period, then the signal would never go low.
w
12 Computer Organization and Design Fundamentals
It is also common to represent the rate of the pulses in a periodic
pulse train with the inverse measurement of the period. This
measurement, called the frequency of the periodic pulse train has units
of cycles/second, otherwise known as Hertz (Hz).
To determine the frequency of a periodic pulse train from the period,
invert the measurement for the period.
1
Frequency = (1.1)
Period in seconds
Example
If it takes 0.1 seconds for a periodic pulse train to make a complete
cycle or period, what is that waveform’s frequency?
Solution
1
Frequency =
Period in seconds
1
Frequency =
0.1 seconds
Frequency = 10 Hz
Example
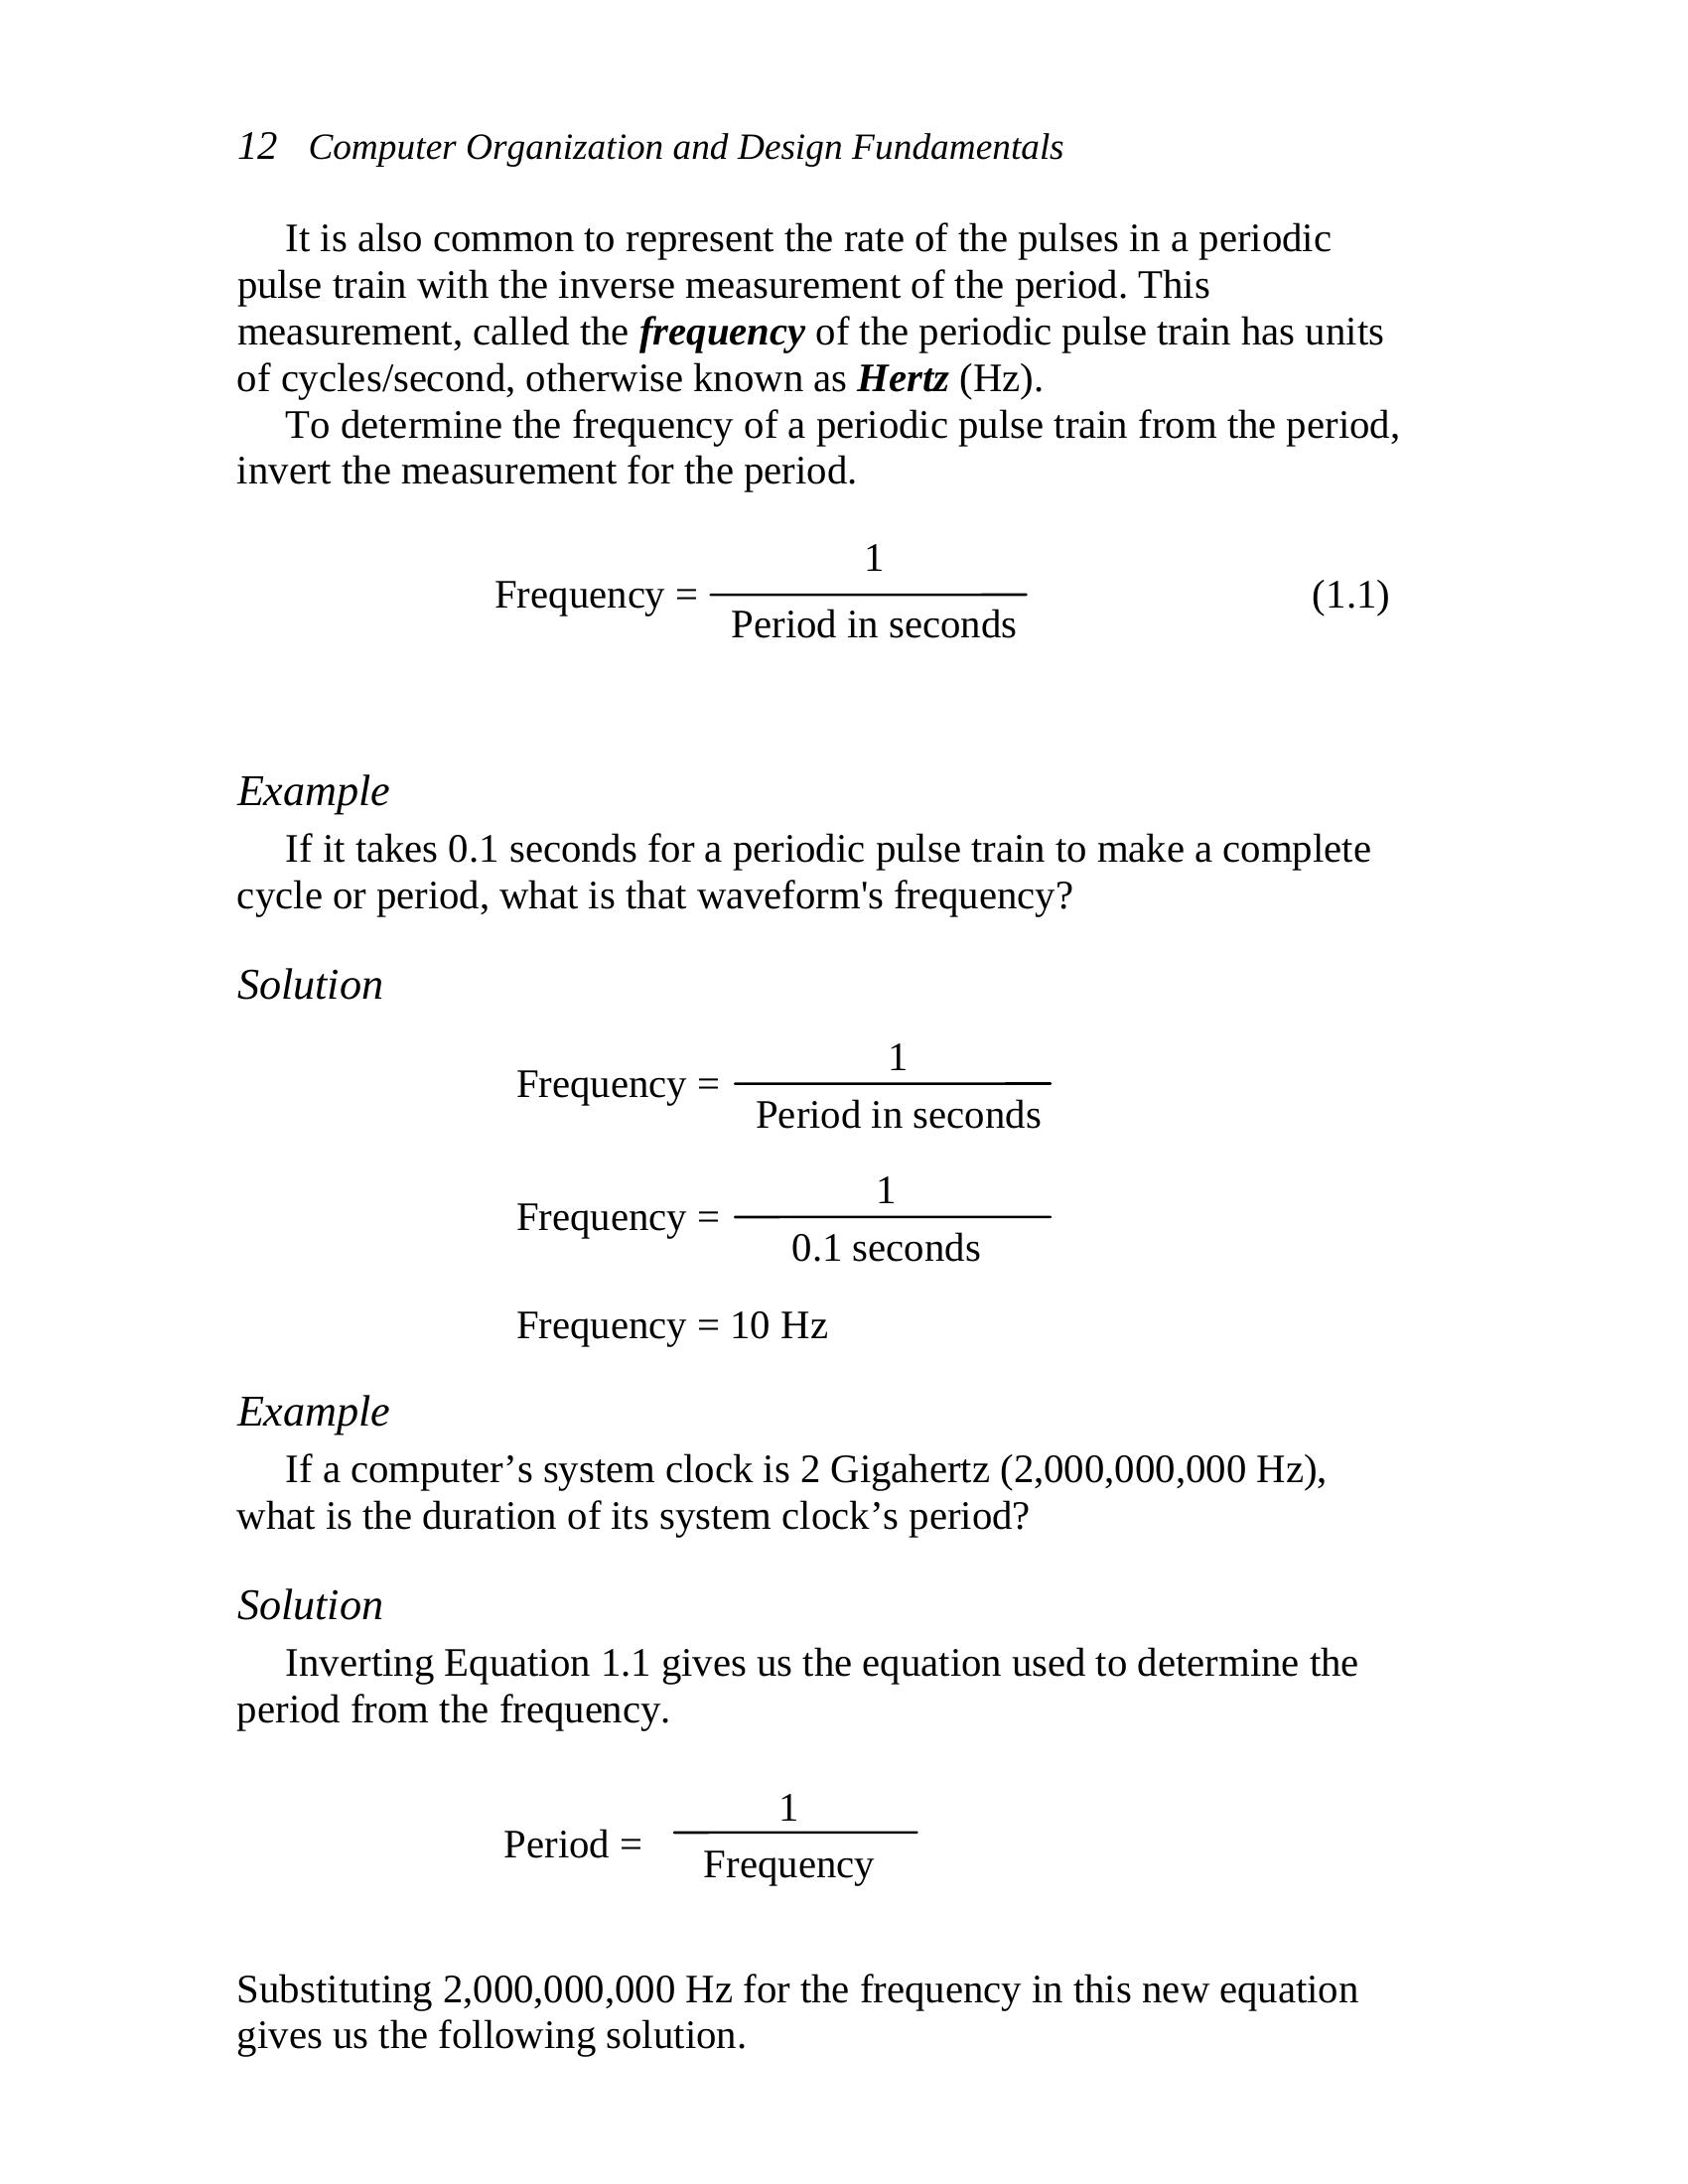
If a computer’s system clock is 2 Gigahertz (2,000,000,000 Hz),
what is the duration of its system clock’s period?
Solution
Inverting Equation 1.1 gives us the equation used to determine the
period from the frequency.
1
Period =
Frequency
Substituting 2,000,000,000 Hz for the frequency in this new equation
gives us the following solution.
Chapter 1: Digital Signals and Systems 13
1
Period =
2,000,000,000 Hz
Period = 0.0000000005 seconds = 0.5 nanoseconds
1.6.5 Pulse-Width Modulation
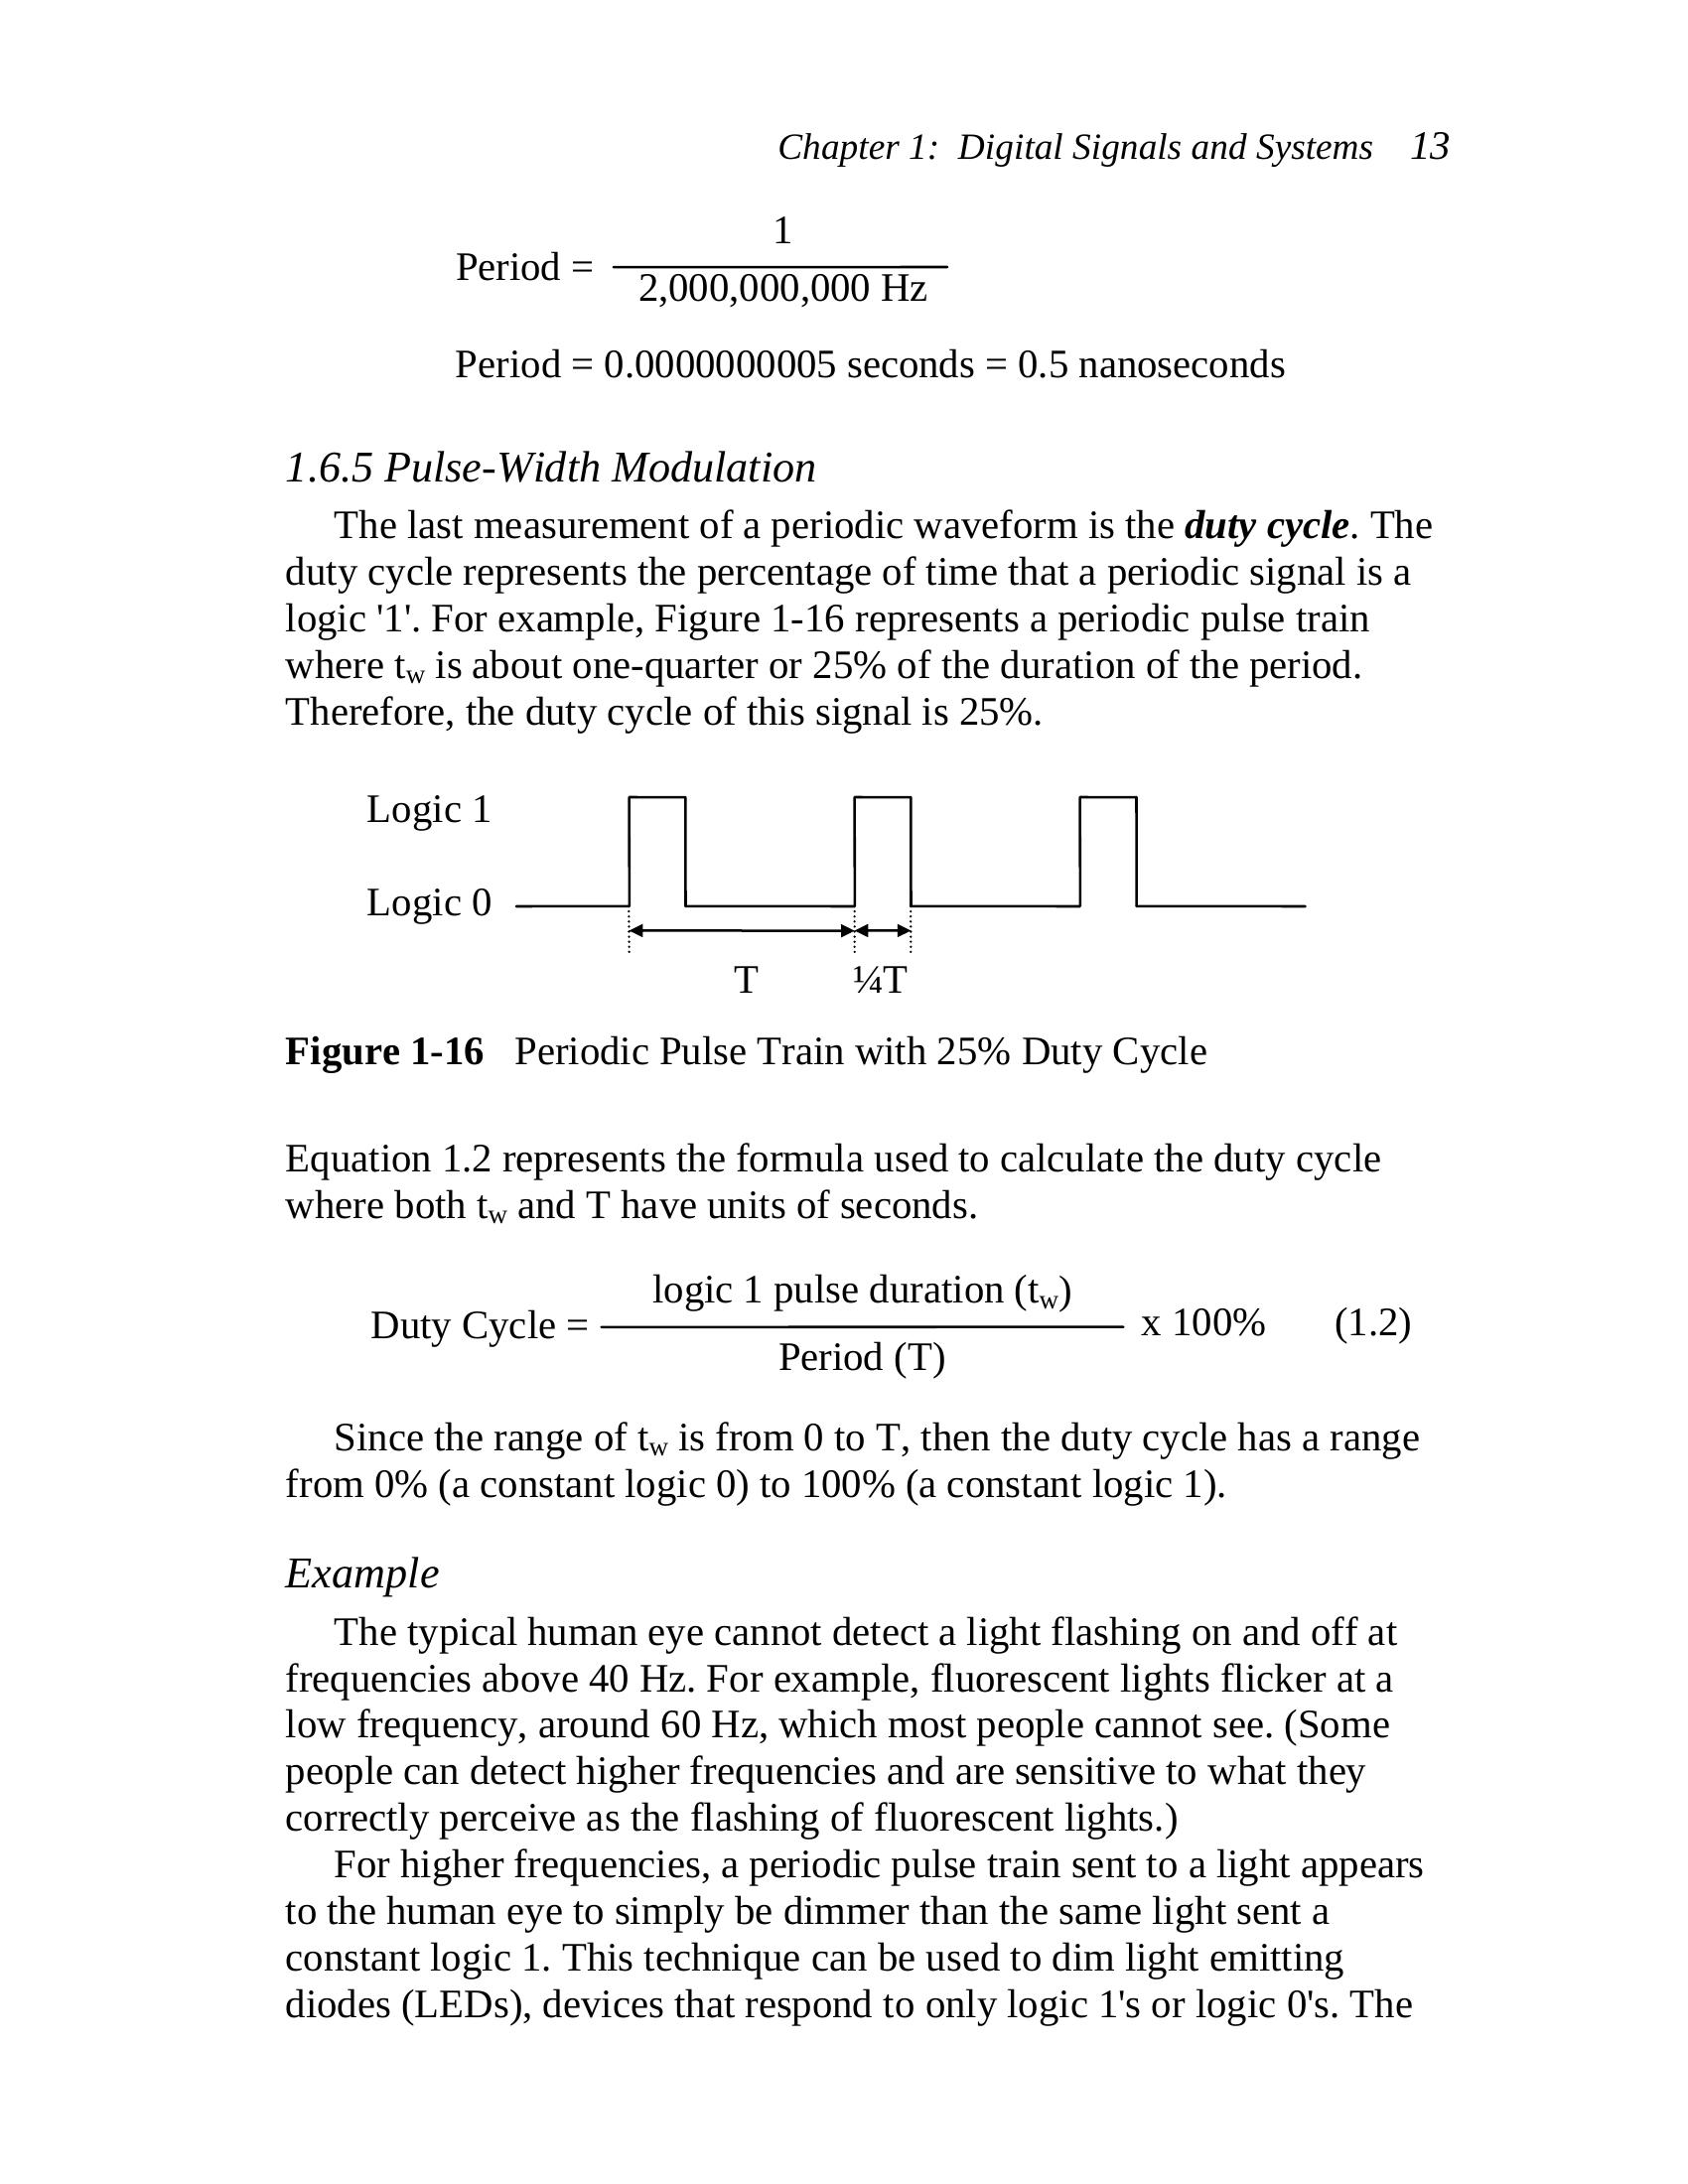
The last measurement of a periodic waveform is the duty cycle. The
duty cycle represents the percentage of time that a periodic signal is a
logic ‘1’. For example, Figure 1-16 represents a periodic pulse train
where t is about one-quarter or 25% of the duration of the period.
w
Therefore, the duty cycle of this signal is 25%.
Logic 1
Logic 0
T ¼T
Figure 1-16 Periodic Pulse Train with 25% Duty Cycle
Equation 1.2 represents the formula used to calculate the duty cycle
where both t and T have units of seconds.
w
logic 1 pulse duration (t w)
Duty Cycle = x 100% (1.2)
Period (T)
Since the range of t is from 0 to T, then the duty cycle has a range
w
from 0% (a constant logic 0) to 100% (a constant logic 1).
Example
The typical human eye cannot detect a light flashing on and off at
frequencies above 40 Hz. For example, fluorescent lights flicker at a
low frequency, around 60 Hz, which most people cannot see. (Some
people can detect higher frequencies and are sensitive to what they
correctly perceive as the flashing of fluorescent lights.)
For higher frequencies, a periodic pulse train sent to a light appears
to the human eye to simply be dimmer than the same light sent a
constant logic 1. This technique can be used to dim light emitting
diodes (LEDs), devices that respond to only logic 1’s or logic 0’s. The
14 Computer Organization and Design Fundamentals
brightness of the LED with respect to the full on state is equivalent to
the duty cycle. For example, to make an LED shine half as bright as it
would with a constant logic 1 sent to it, the duty cycle should be 50%.
The frequency is irrelevant as long as it is higher than the human eye
can detect.
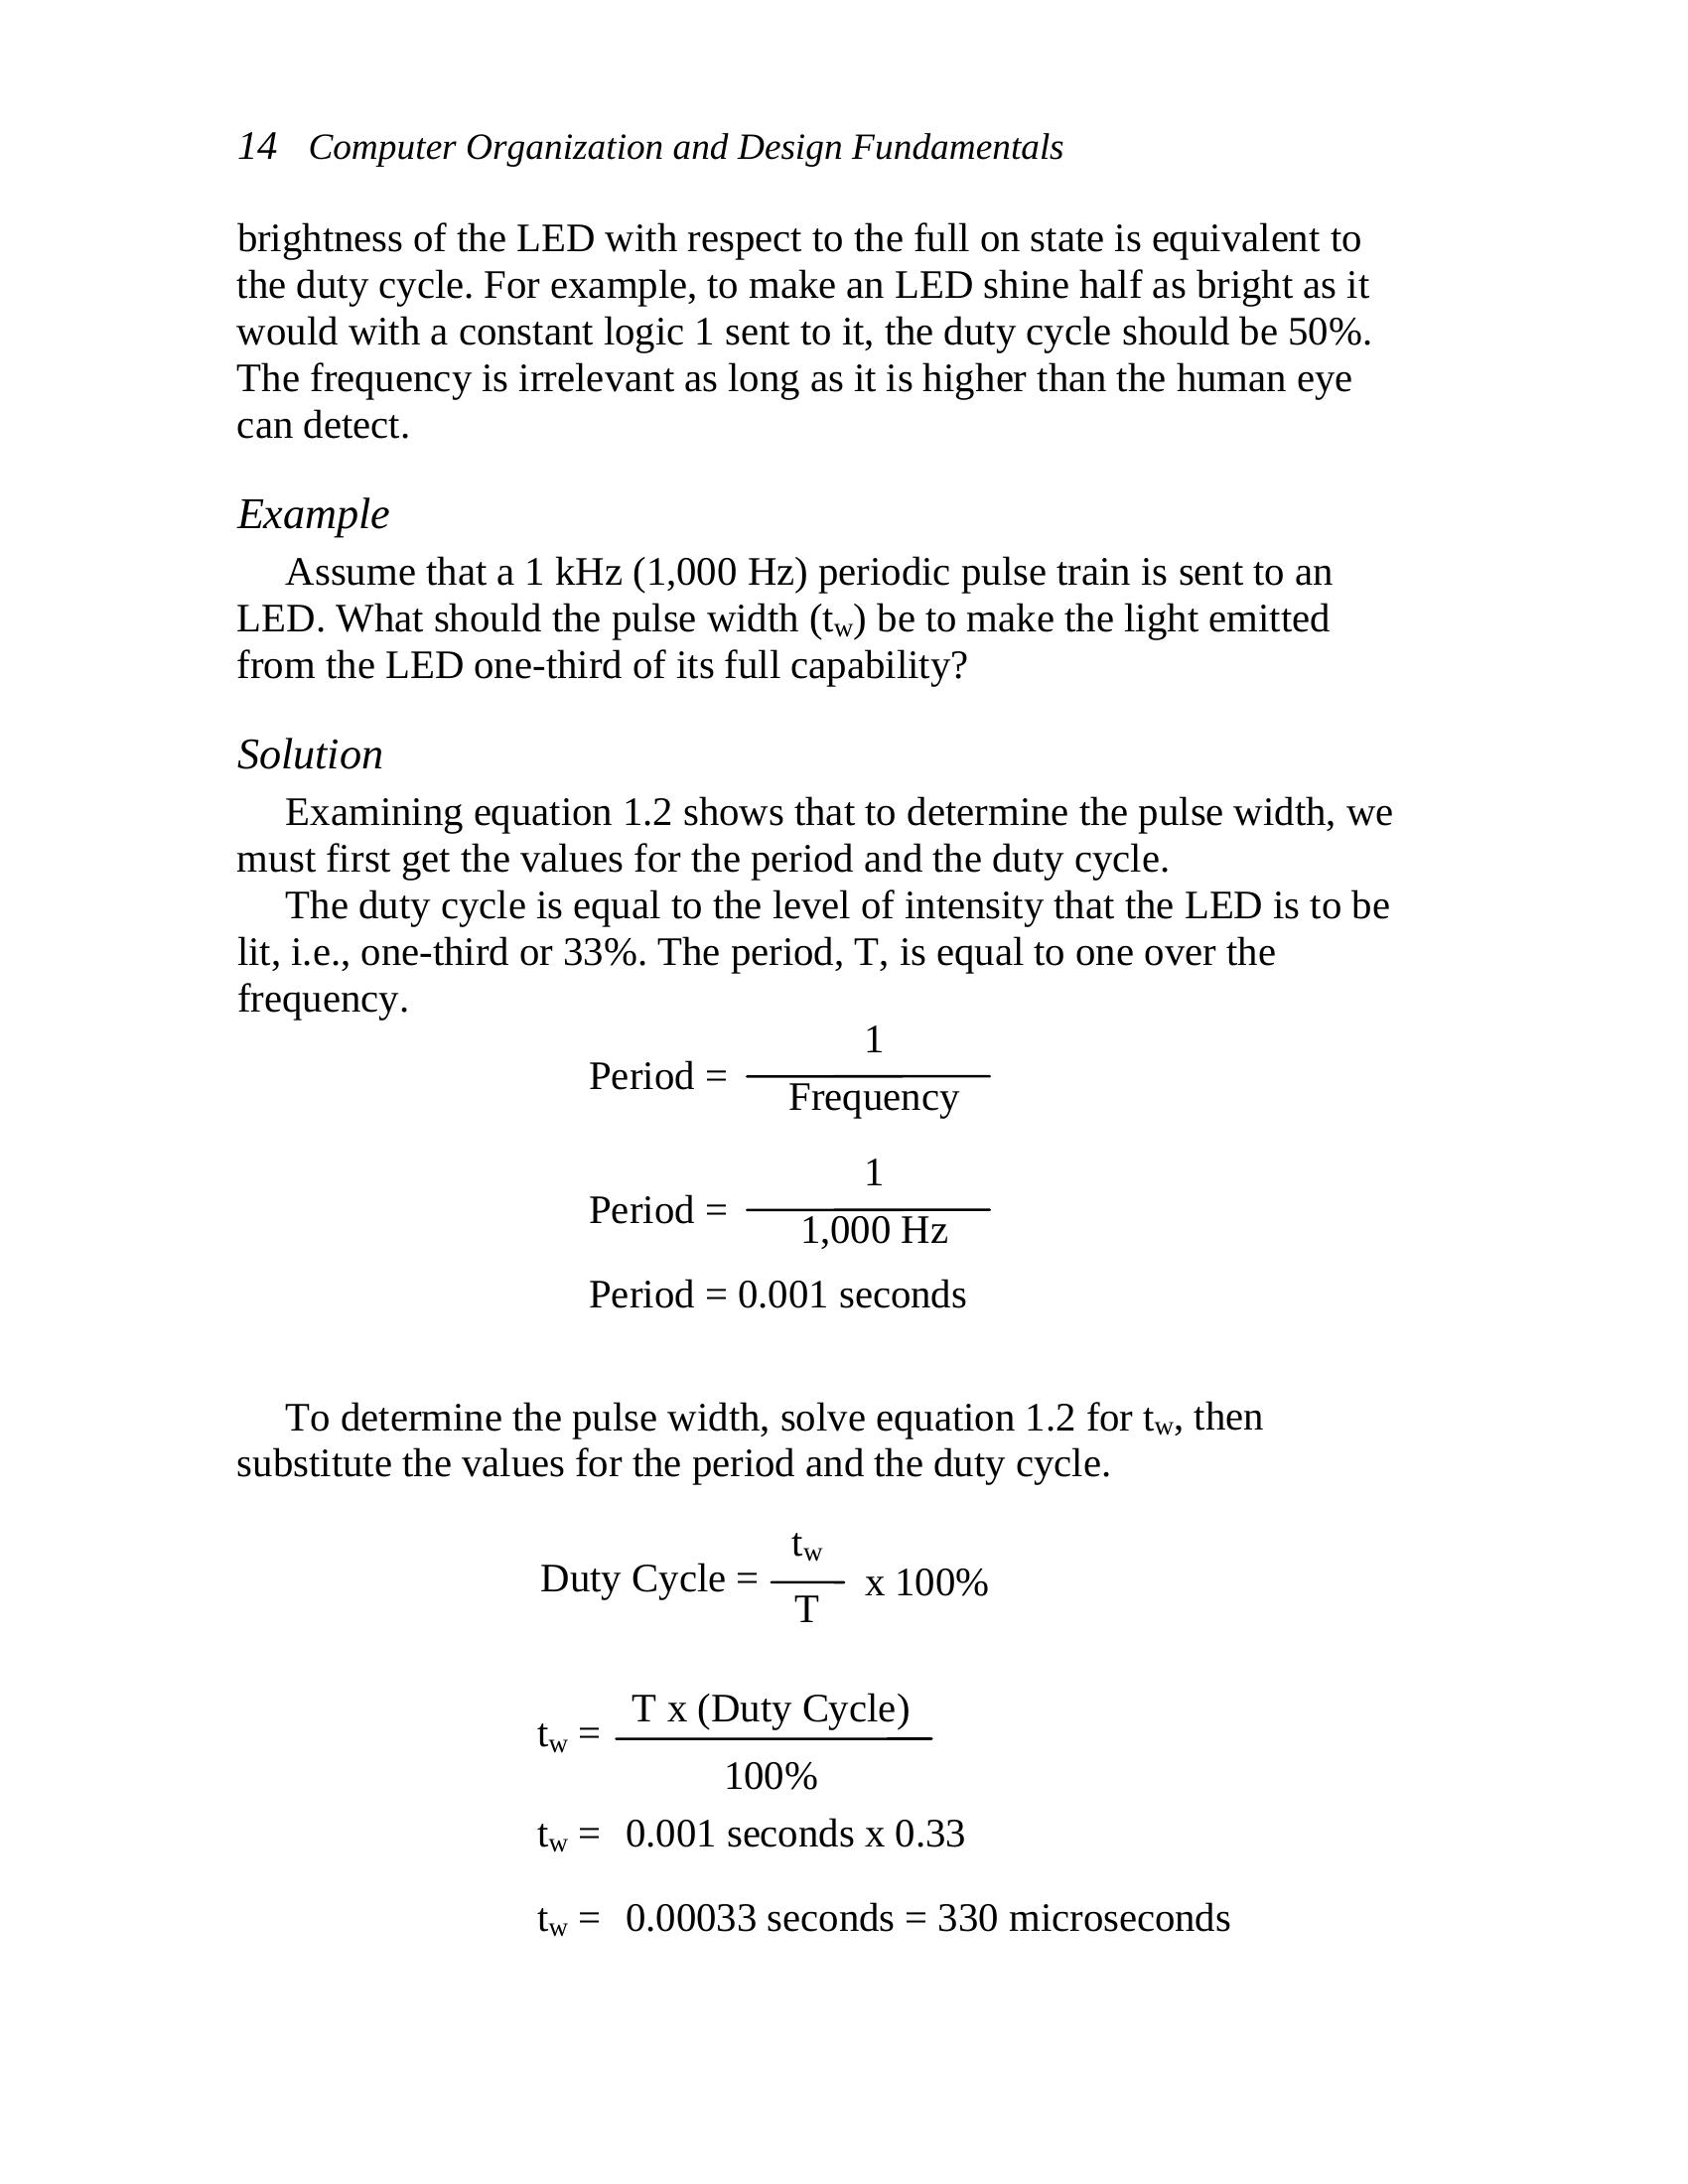
Example
Assume that a 1 kHz (1,000 Hz) periodic pulse train is sent to an
LED. What should the pulse width (t ) be to make the light emitted
w
from the LED one-third of its full capability?
Solution
Examining equation 1.2 shows that to determine the pulse width, we
must first get the values for the period and the duty cycle.
The duty cycle is equal to the level of intensity that the LED is to be
lit, i.e., one-third or 33%. The period, T, is equal to one over the
frequency.
1
Period =
Frequency
1
Period =
1,000 Hz
Period = 0.001 seconds
To determine the pulse width, solve equation 1.2 for t , then
w
substitute the values for the period and the duty cycle.
t
w
Duty Cycle = x 100%
T
T x (Duty Cycle)
t =
w
100%
t = 0.001 seconds x 0.33
w
t = 0.00033 seconds = 330 microseconds
w
Chapter 1: Digital Signals and Systems 15
1.7 Unit Prefixes
You may have noticed that in some of our examples, a prefix was
used with the units of seconds or Hertz. This is done to reduce the
number of leading zeros between a decimal point and a magnitude or to
reduce the number of trailing zeros in a very large magnitude.
A prefix replaces a power of 10 multiplier. For example, the
measurement 5,000 hertz is equivalent to 5 x 10³ hertz. The multiplier
103 can be replaced with the prefix “kilo” giving us 5 kilohertz. Each
prefix has a single-letter abbreviation that can be used with the
abbreviation of the units. For example, to use kilo with the abbreviation
Hz, the single letter “k” would be used giving us kHz.
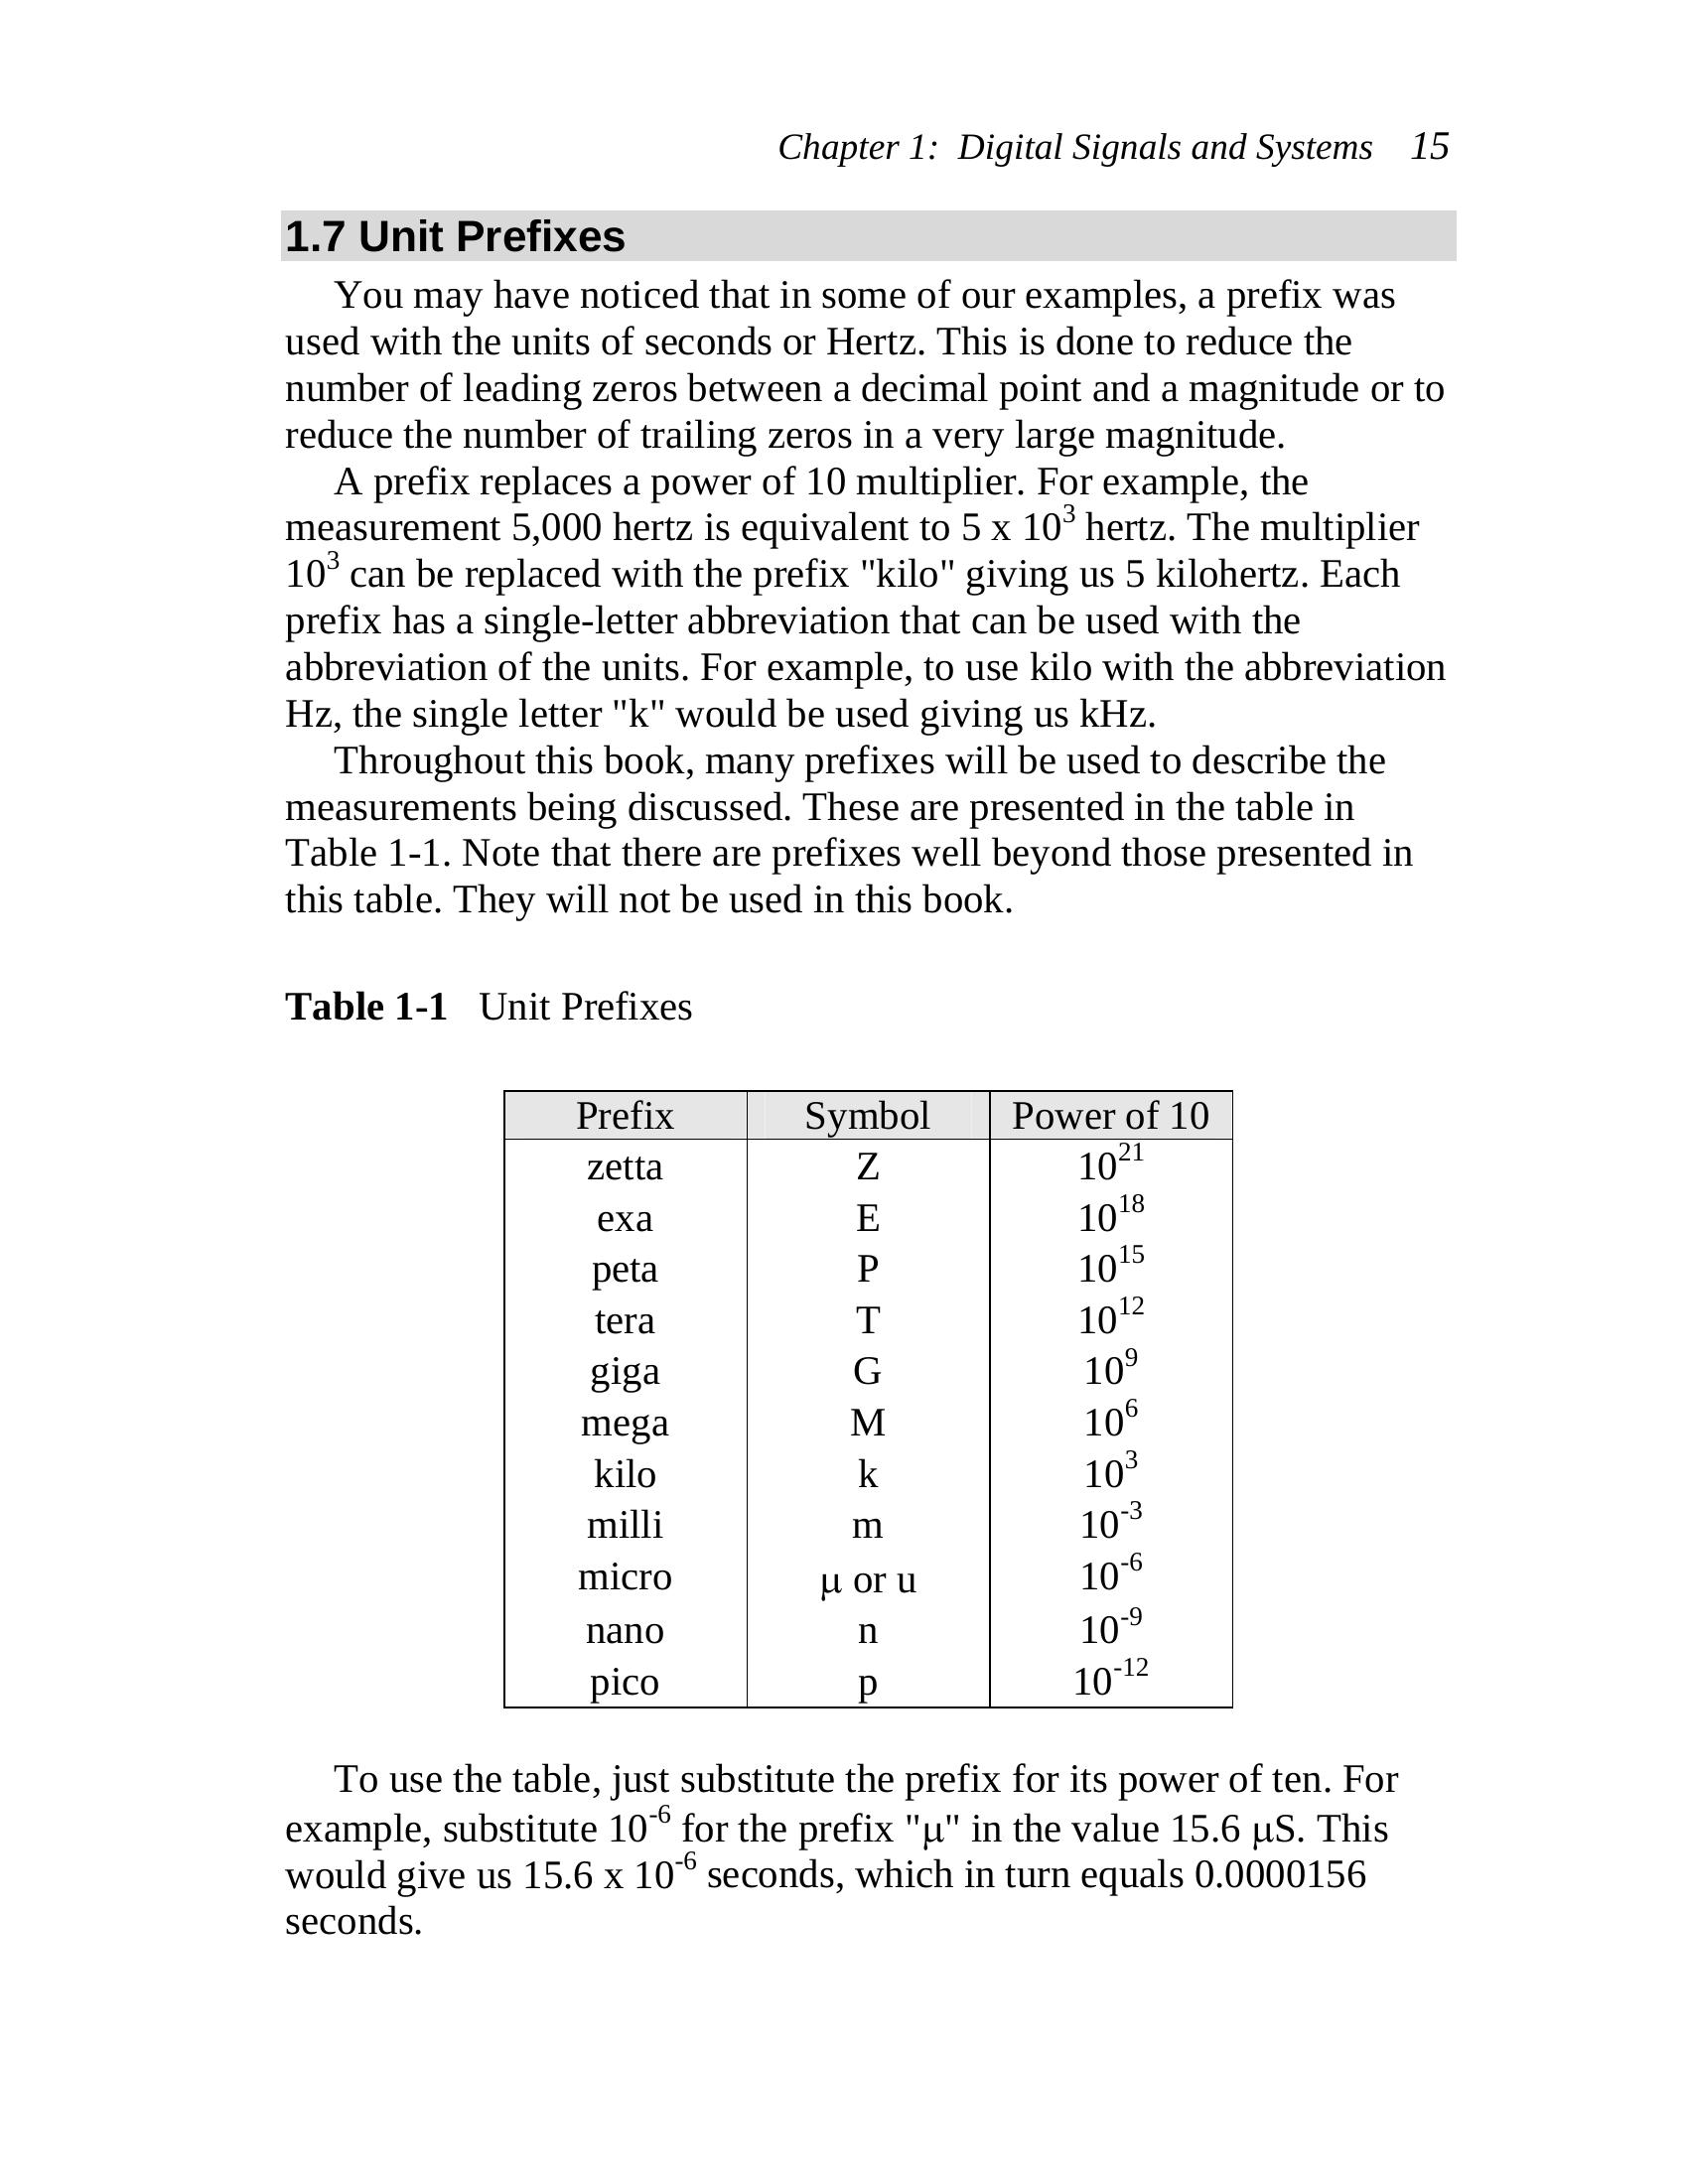
Throughout this book, many prefixes will be used to describe the
measurements being discussed. These are presented in the table in
Table 1-1. Note that there are prefixes well beyond those presented in
this table. They will not be used in this book.
Table 1-1 Unit Prefixes
Prefix Symbol Power of 10
zetta Z 1021
exa E 1018
peta P 1015
tera T 1012
giga G 109
mega M 106
kilo k 103
milli m 10-3
micro μ or u 10-6
nano n 10-9
pico p 10-12
To use the table, just substitute the prefix for its power of ten. For
example, substitute 10-6 for the prefix “μ” in the value 15.6 μS. This
would give us 15.6 x 10⁻⁶ seconds, which in turn equals 0.0000156
seconds.
| Prefix | Symbol | Power of 10 | |||||
| zetta exa peta tera giga mega kilo milli micro nano pico | None | None | Z E P T G M k m μ or u n p | None | None | 1021 1018 1015 1012 109 106 103 10-3 10-6 10-9 10-12 | None |
16 Computer Organization and Design Fundamentals
1.8 What’s Next?
In this chapter, we’ve seen how the methods that a computer uses to
store and interpret values are different from the ways in which those
values appear in the real world. We’ve also seen some of the methods
used to measure and represent these digital signals.
In Chapter 2 we will see how digital values are used to represent
integers. This is the first major step toward understanding some of the
idiosyncrasies of computing systems such as why a compiler might
restrict the values of a data type from –32,768 to 32,767. In addition, it
shows how some bugs occur in programs due to the misuse of data
types.
Problems
1. Define the term “sample” as it applies to digital systems.
2. Define the term “sampling rate” as it applies to digital systems.
3. What are the two primary problems that sampling could cause?
4. Name the three parts of the system used to input an analog signal
into a digital system and describe their purpose.
5. Name four benefits of a digital system over an analog system.
6. Name three drawbacks of a digital system over an analog system.
7. True or False: Since non-periodic pulse trains do not have a
predictable format, there are no defining measurements of the
signal.
8. If a computer runs at 12.8 GHz, what is the period of its clock
signal?
9. If the period of a periodic pulse train is 125 nanoseconds, what is
the signal’s frequency?
10. If the period of a periodic pulse train is 50 microseconds, what
should the pulse width, t , be to achieve a duty cycle of 15%?
w
11. True or False: A signal’s frequency can be calculated from its duty
cycle alone.
